Opening Statement (ORB)
AsksDid the first fifteen minutes mean it?
Draws the opening range and marks breaks and retests of its edges.
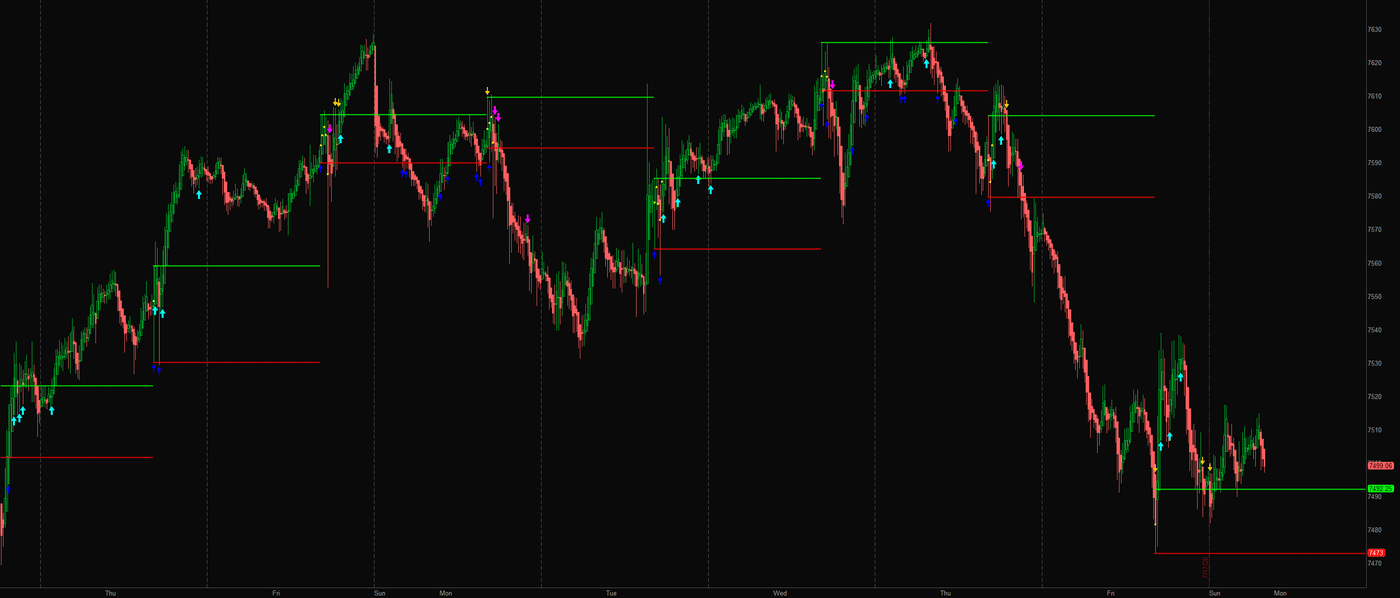
What it measures and how
The session makes its opening statement; this study keeps the range on the chart. It builds a high and low during the selected opening window, displays those rails after the window ends, and marks qualifying breaks and retests. Optional targets project the range width beyond the broken edge.
Get started
- Paste the complete downloaded file into a new study through Charts → Studies → Edit Studies → Create in thinkorswim desktop.
- Use an intraday chart with an aggregation at or below rangeMinutes. Check that rangeStartTime and the chart's session bars cover the opening window you intend to measure.
- Wait for the status to move from FORMING to the completed high, low, and width. Range rails are hidden while the window is forming.
- Read cyan and magenta as breakout markers, then blue and yellow as qualifying retests. Enable measured targets only if you want that additional range-width reference.
How to read it
The opening evidenceThe study accumulates highs and lows during the opening window and carries the completed range forward. It resets its range and signal flags when its day changes.
A break and a returnAn upward break requires the current close value above the high with the previous close at or below it; the downward side is mirrored. A retest touches a previously broken edge and has its current close back on the breakout side.
Why some marks stay quietThere is at most one breakout and one qualifying retest per side per day. More than retestCooldownBars must pass since the previous qualifying touch on either side, including touches that printed no arrow. Repeated touches restart that shared wait; the first retest can occur immediately after a breakout. Optional targets multiply the range width and project it from the broken boundary.
Know the limits
The script checks the active candle's close value without a completed-bar gate. Breakout and retest markers can change before the candle finishes.
The opening window needs matching chart bars and session coverage. A chart interval that crosses the range boundary can include prices outside the intended window.
Measured targets are geometric references, not expected returns. The script does not provide position sizing, stops, or order execution.
Open source, no email wall. Read the code, test it on your own chart, and keep it. Explore all 20 free tools.
Keep the tool.
Add a second read.
Opening Statement marks the opening range, breaks and retests. Keep that focused view.
The paid MIZAN engine runs on TradingView. It adds the market read, the score and explained blocked setups for the candidates it detects. Reversal setups that pass get entry, stop and target references.
MIZAN is a separate engine, not a bundle of these free tools. Compare its read with your own method.
See passed setups, blocked setups and losses →
7-day trial starts at checkout · From $79.99/month afterward · Cancel through Whop · Manual access within six hours after checkout and receipt of your correct TradingView username