On the chart

The full tape. Winners, losers, and every refusal.

Nothing cherry-picked. Nothing cropped out.

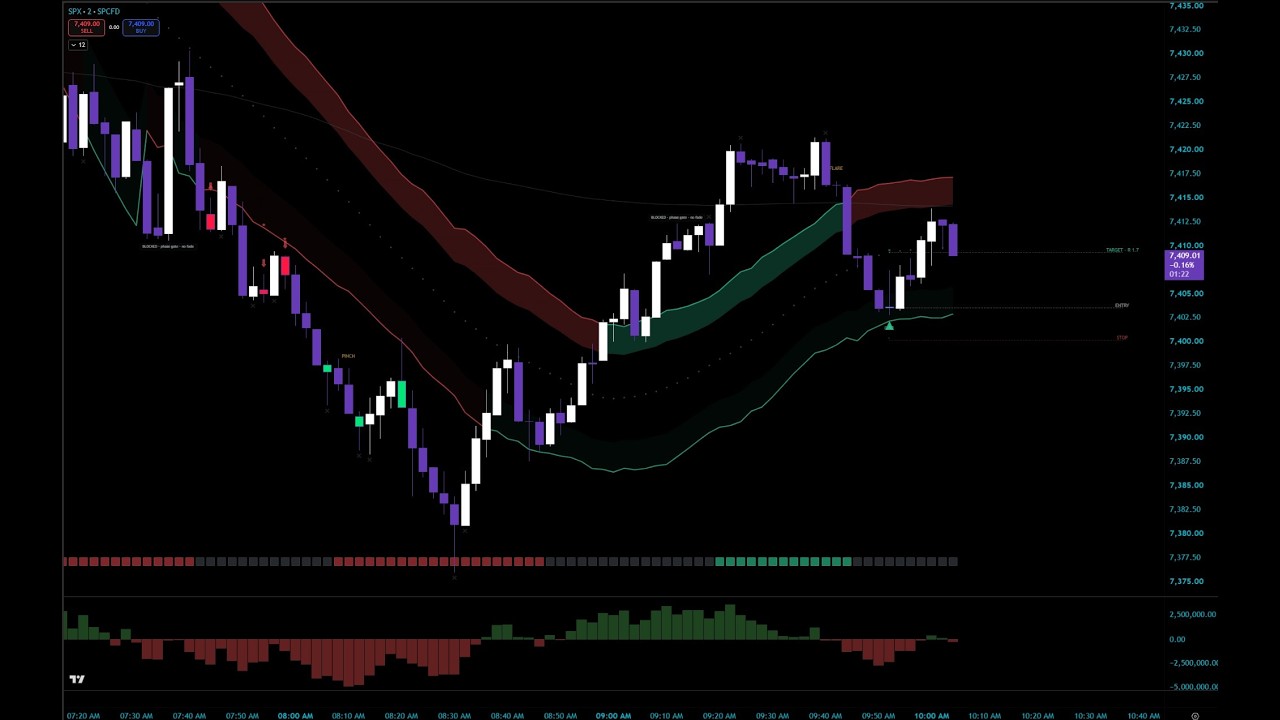
Every chart below is the live engine on real tape, 9 complete unedited sessions, 45+ hours of tape you can skip through anywhere, including a full consecutive week. The marks you see — including the gray BLOCKED tags — are what the stack actually printed. Tap any chart to zoom.

Shown because we publish everything — the losers included. Educational display, not financial advice; trading involves substantial risk of loss, and past performance does not indicate future results.

One trading week, unedited

Monday 27 July to Friday 31 July. 5 consecutive sessions, 27+ hours, every day of that week and no days left out. A single good session proves nothing. A whole week has to include the flat stretches.

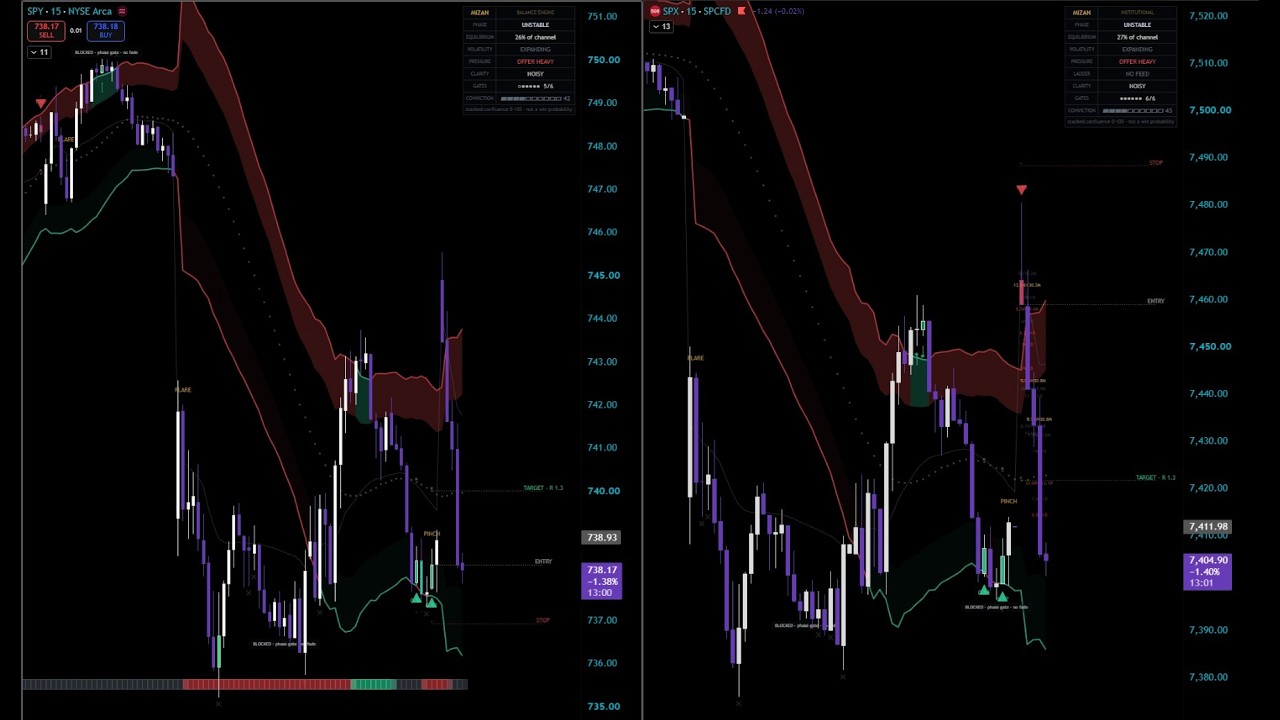
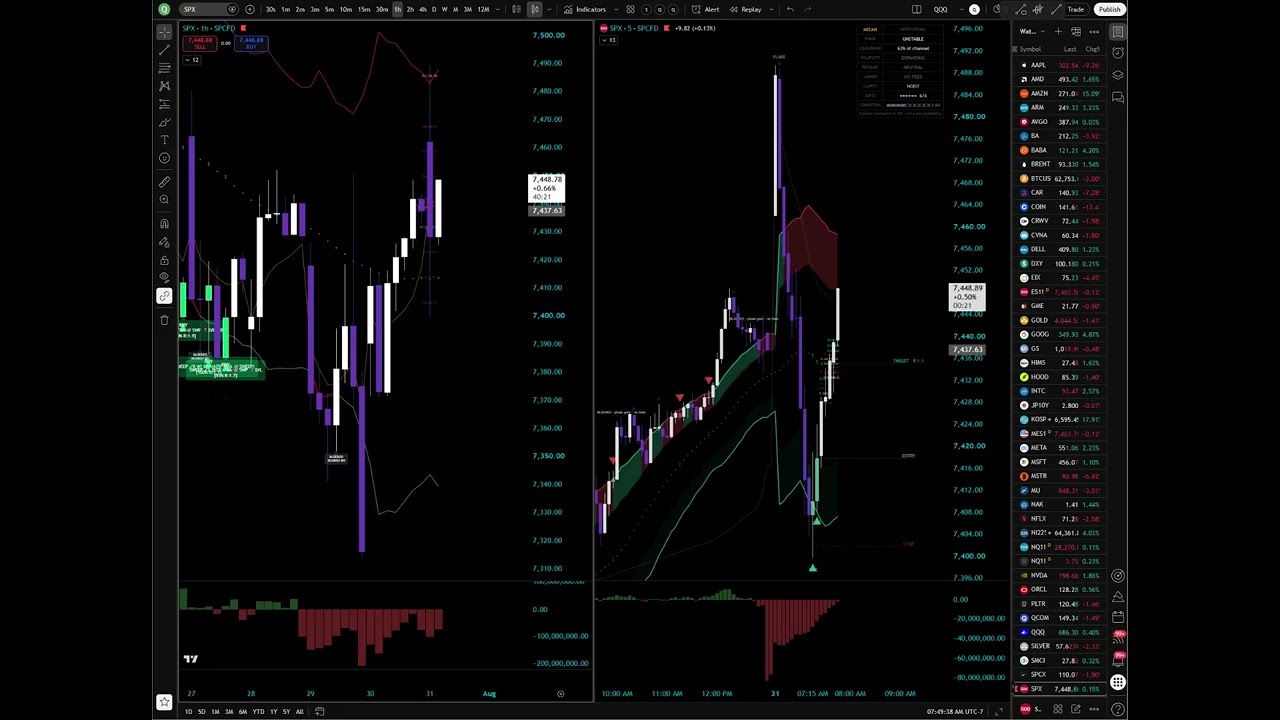
MIZAN running live on SPY and SPX side by side, Monday 27 July, full unedited session
Mon 7/27 · 5h 32m · unedited Day one, two indices on one screen. Core and Institutional reading the same tape, every print and every refusal as it happened.
MIZAN running live on a TradingView chart, Tuesday 7/28, full unedited session
Tue 7/28 · 5h 48m · unedited The blocks are the point on this one. Setups that looked clean, scored below the gate, and got refused.
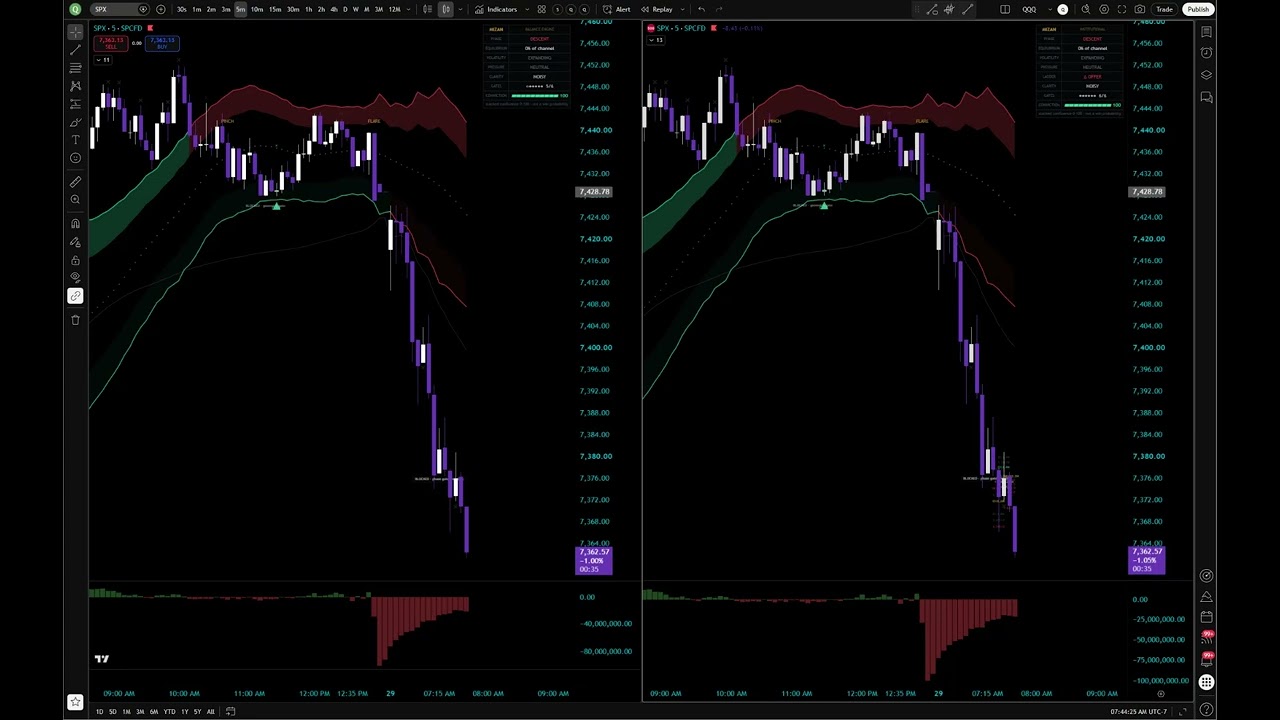
MIZAN running live on a TradingView chart, Wednesday 7/29, first part of the session
Wed 7/29 · part 1 · 1h 36m · unedited Wednesday runs in two parts. This is the morning, before the print.
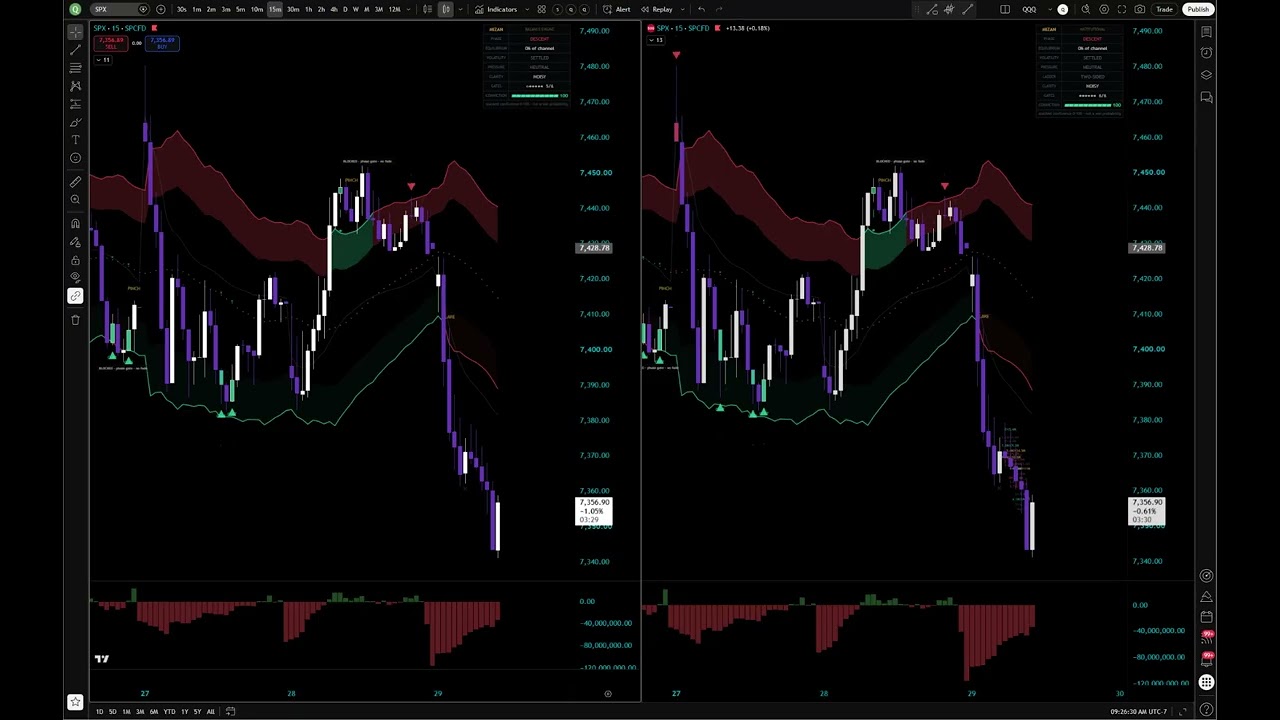
MIZAN running live on a TradingView chart through the FOMC print, Wednesday 7/29
Wed 7/29 · part 2 · 3h 43m · unedited The FOMC session. Watch the conviction number move as the tape gives it reasons to.
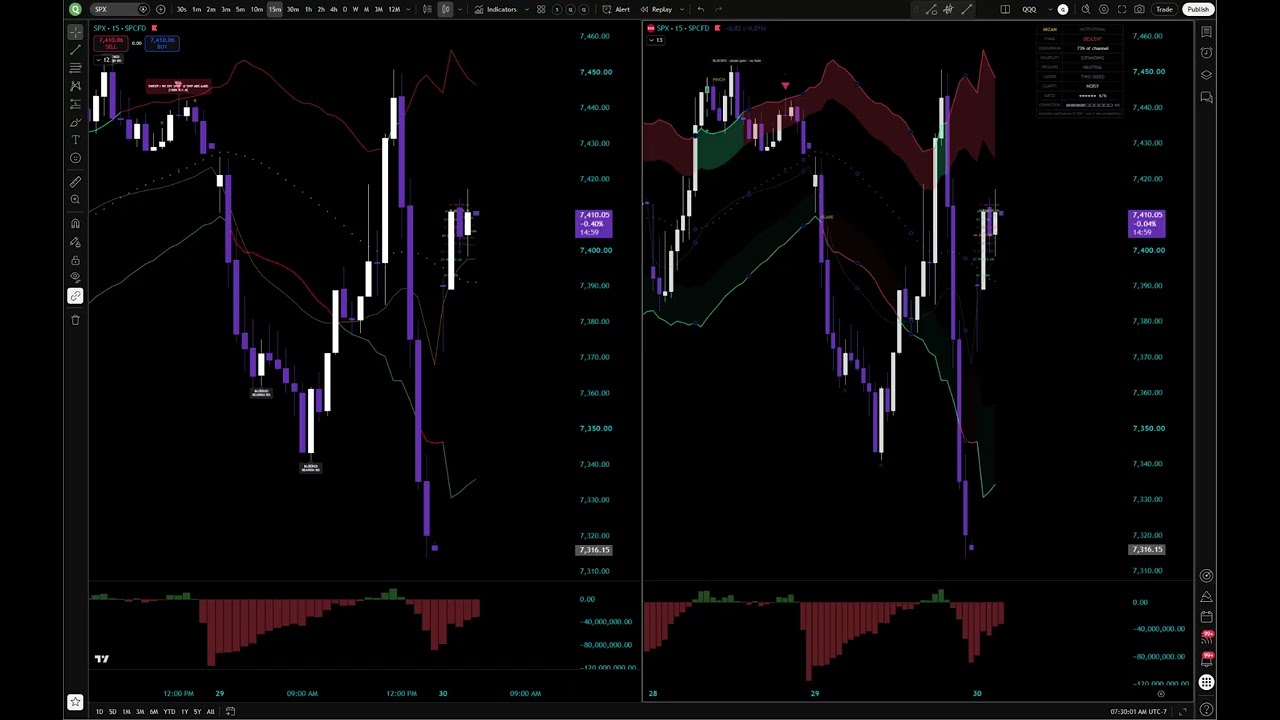
MIZAN running live on a TradingView chart, Thursday 7/30, full unedited session
Thu 7/30 · 5h 38m · unedited Day four. Long stretches of nothing, a few clean reads, and the ones that got thrown out.
MIZAN running live on a TradingView chart, Friday 7/31, full unedited session
Fri 7/31 · 5h 18m · unedited Day five. The week closes with nothing skipped and nothing added.

Earlier sessions

MIZAN running live on a TradingView chart for a six-plus hour unedited session
One sitting · 6+ hours · unedited The longest tape on the page: a single session, open to close and then some. Nothing cut.
MIZAN running live on a TradingView chart, full unedited session
The full tape · 3+ hours · unedited A complete live session with MIZAN on the chart. Skip anywhere; nothing is cherry-picked.
MIZAN running live on the SPX chart, full unedited session
SPX session · 3+ hours · unedited A second complete session: every signal and every refusal on the SPX tape. Opens at a key sequence; drag to zero for the full open.
MIZAN running live on the SPX chart, full unedited session
Session 3 · 3+ hours · unedited A complete session: every signal, every level, and every gate decision as it printed. Start anywhere; the tape is the argument.
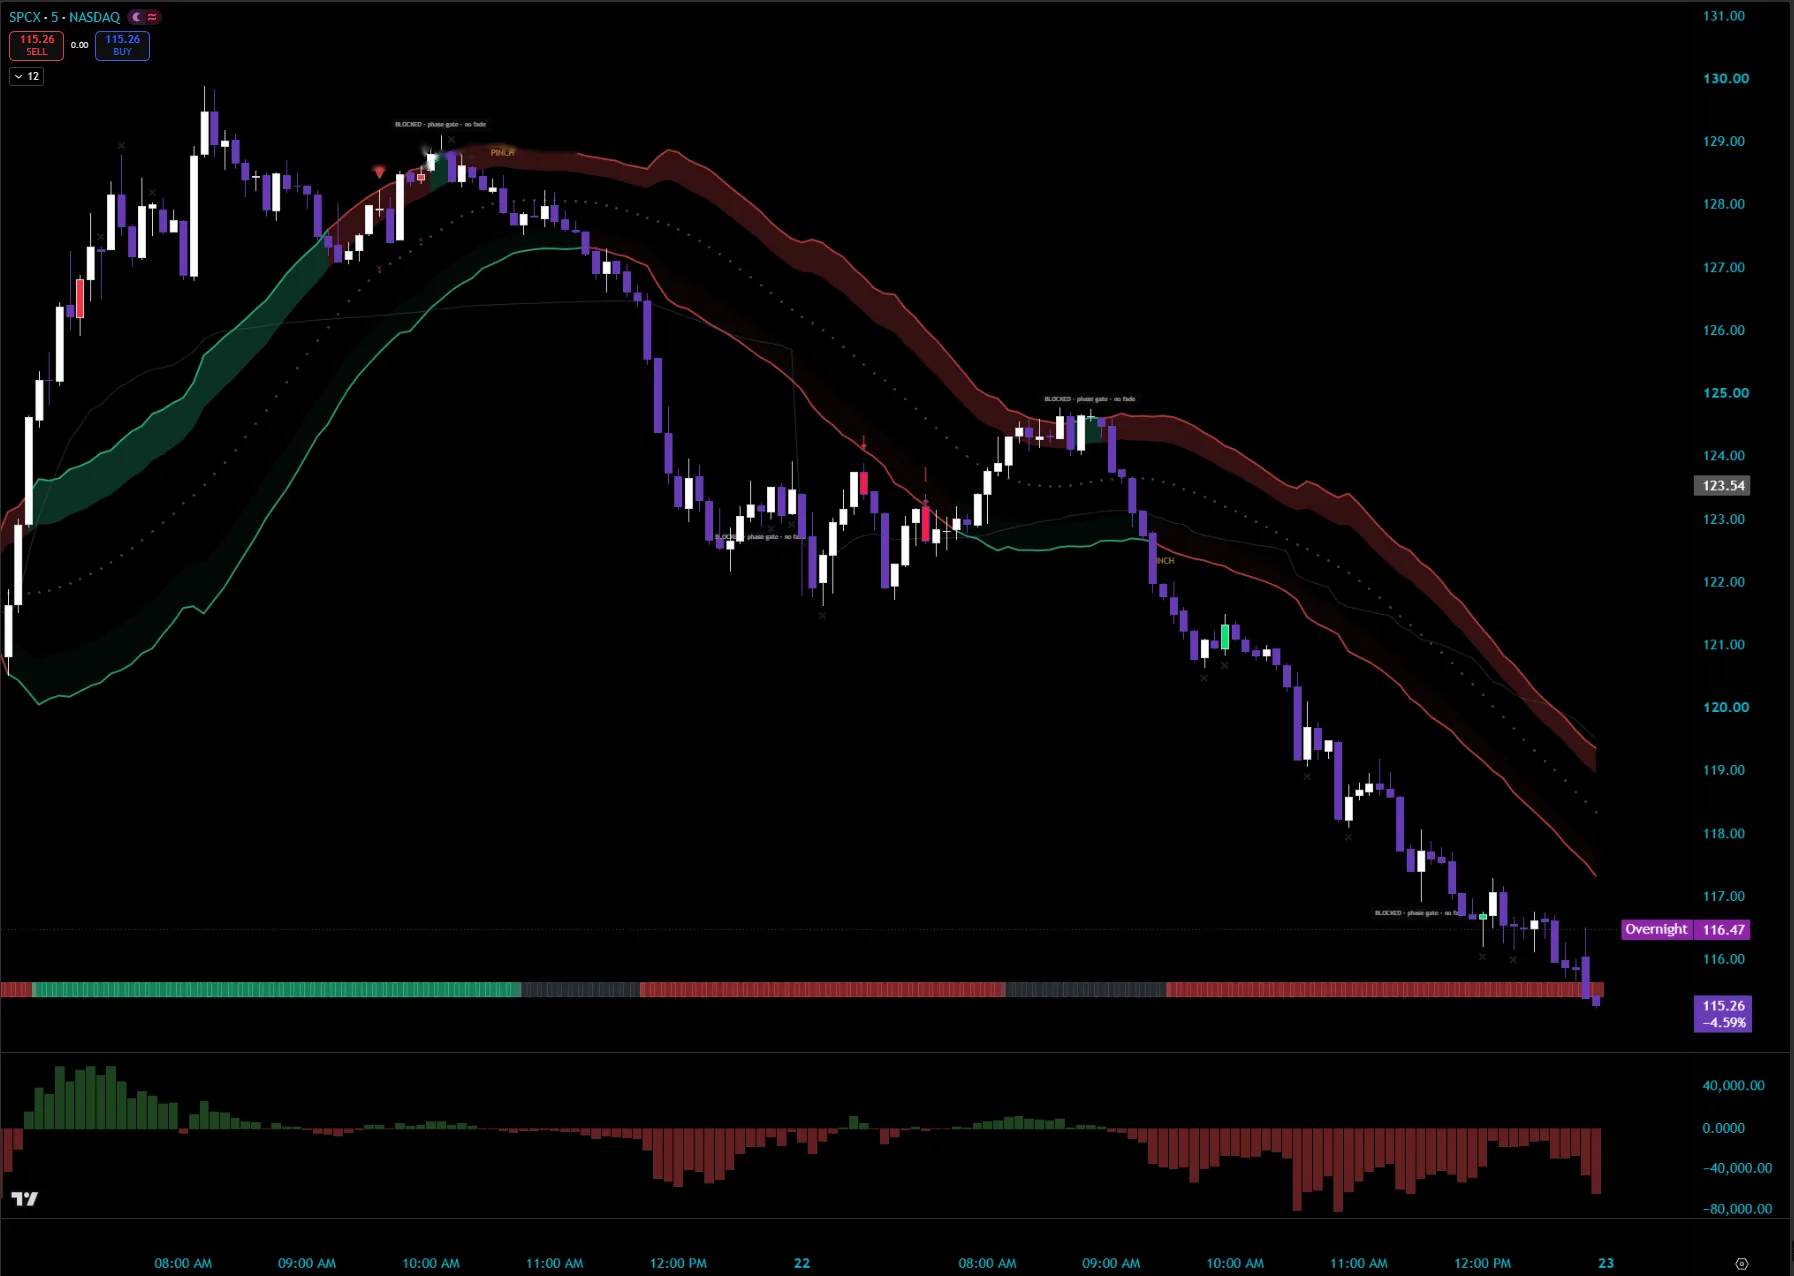
MIZAN on the SPCX 5-minute chart: a two-day slide riding the red band, with PINCH tags at the coils and gray BLOCKED marks where the gate refused countertrend setups
SPCX · 5m · RED-SIDE TAPE Two sessions on the short side of the ledger. Read the order of events: PINCH tagged the coils before they broke, the band capped every bounce, and the countertrend temptations print BLOCKED · phase gate. Refusal on one side is conviction on the other.
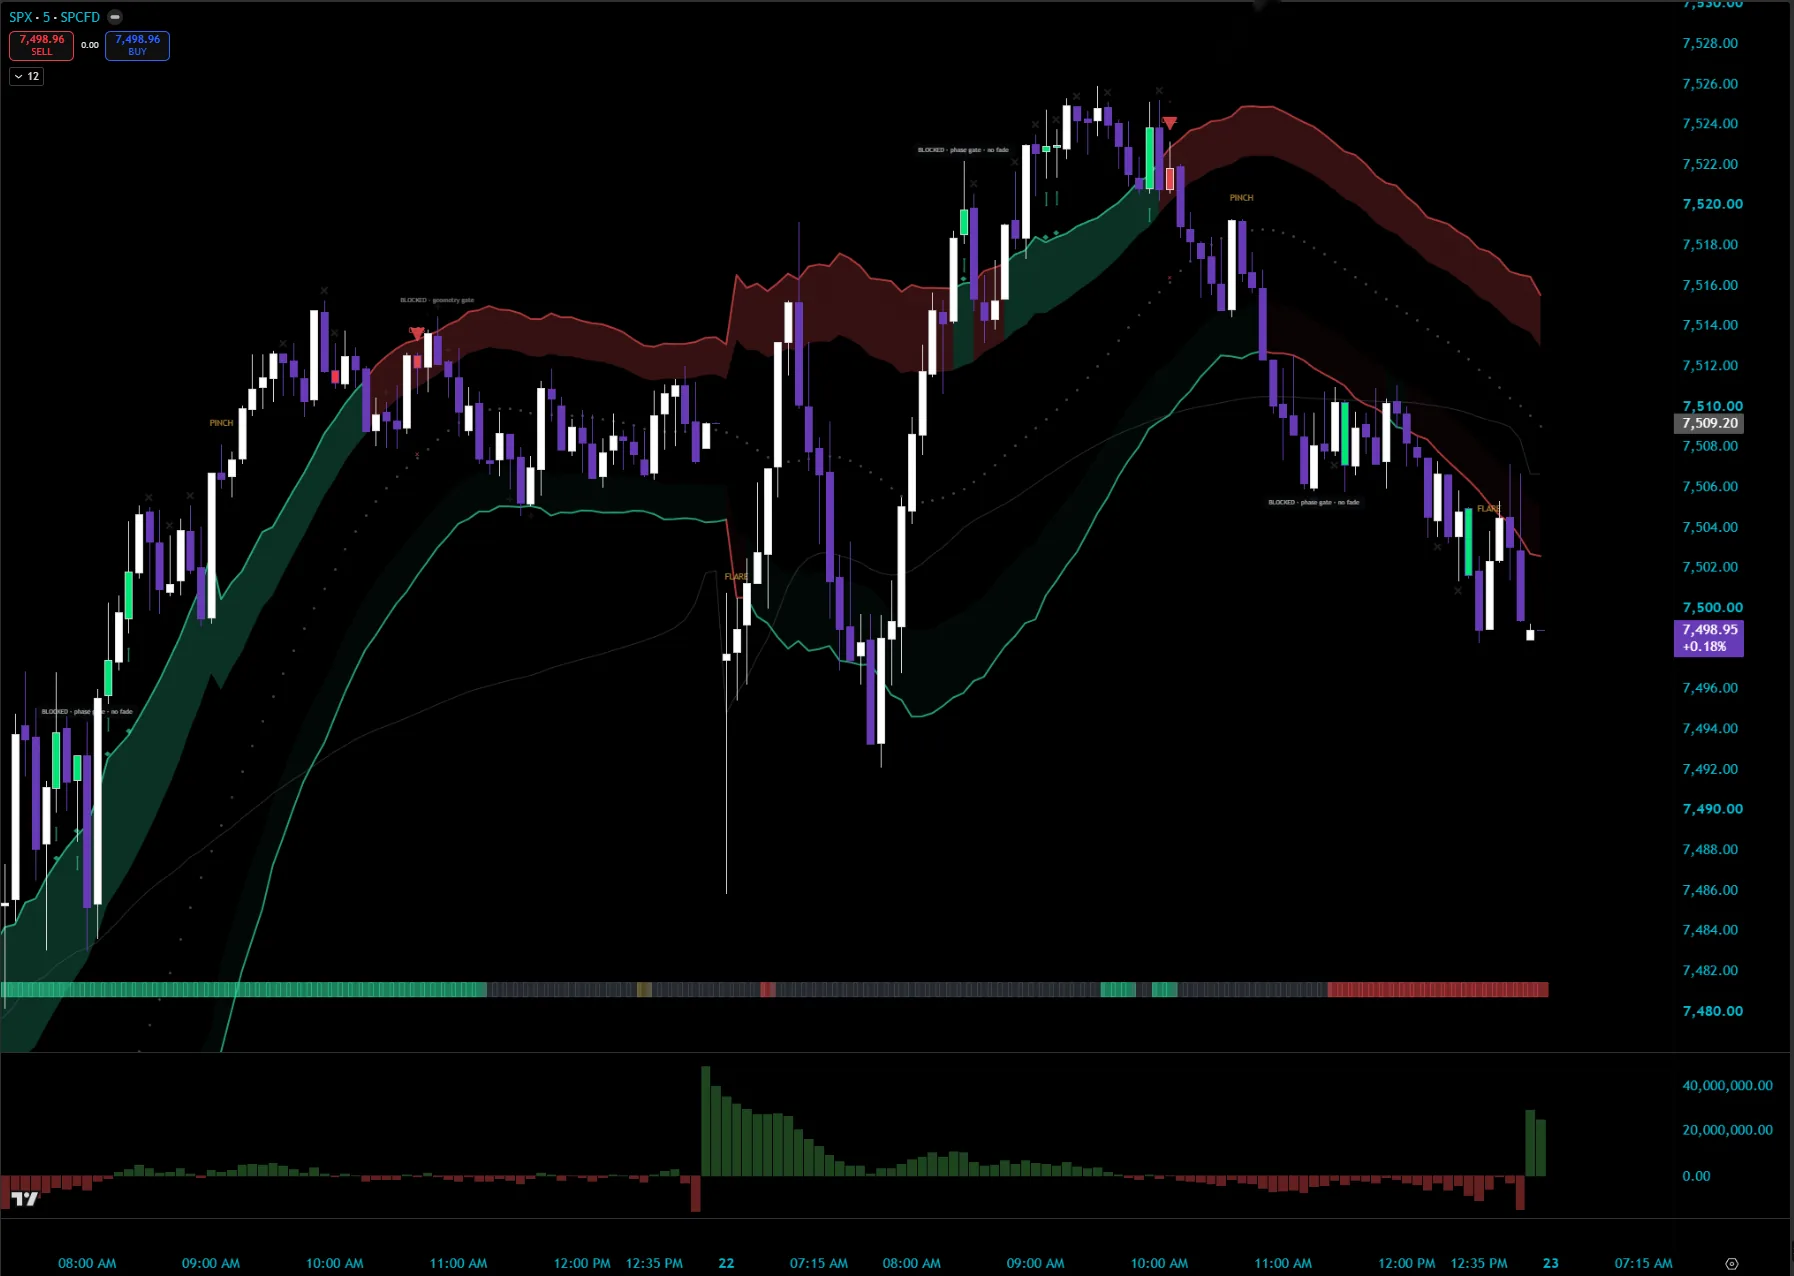
MIZAN on the SPX 5-minute chart across two sessions: BLOCKED tags through the midday chop, a trend leg on the green band, then a confirmed short signal as the band flips at the highs
SPX · 5m · PATIENCE, THEN CONFIRMATION Two sessions of mostly waiting. BLOCKED pills through the midday chop, the trend carried on the green band, and the short printed only after the band flipped at the highs. The signal arrived when the evidence did — not when the candles got exciting.
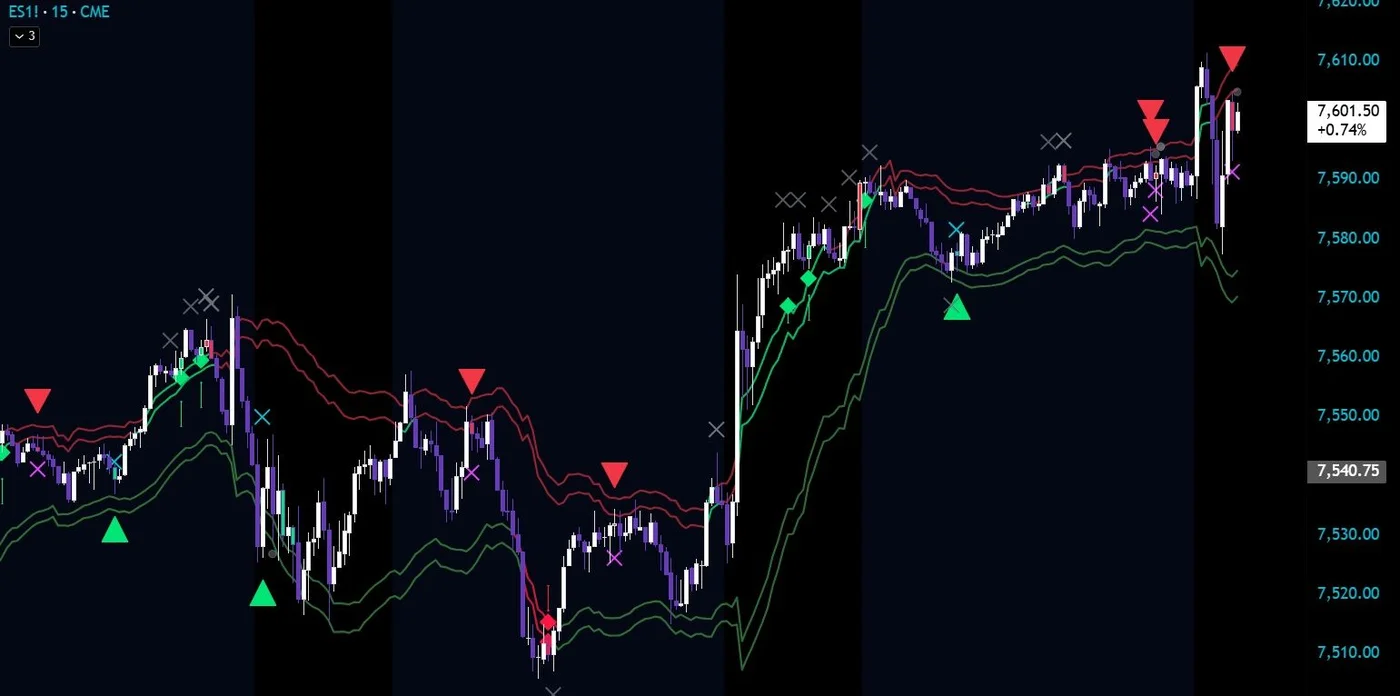
The current build of MIZAN on the ES futures 15-minute chart: paired adaptive bands, long and short triangles, diamond marks, and gray X marks where the stack blocked the setup
ES · 15m · THE CURRENT BUILD Six years of iteration on one engine. The marks have changed shape across versions; the discipline behind them hasn’t. Today it prints the full grammar — long and short triangles where the stack agreed, diamond confirmations, and the gray X where it said no — on the chart before you act.
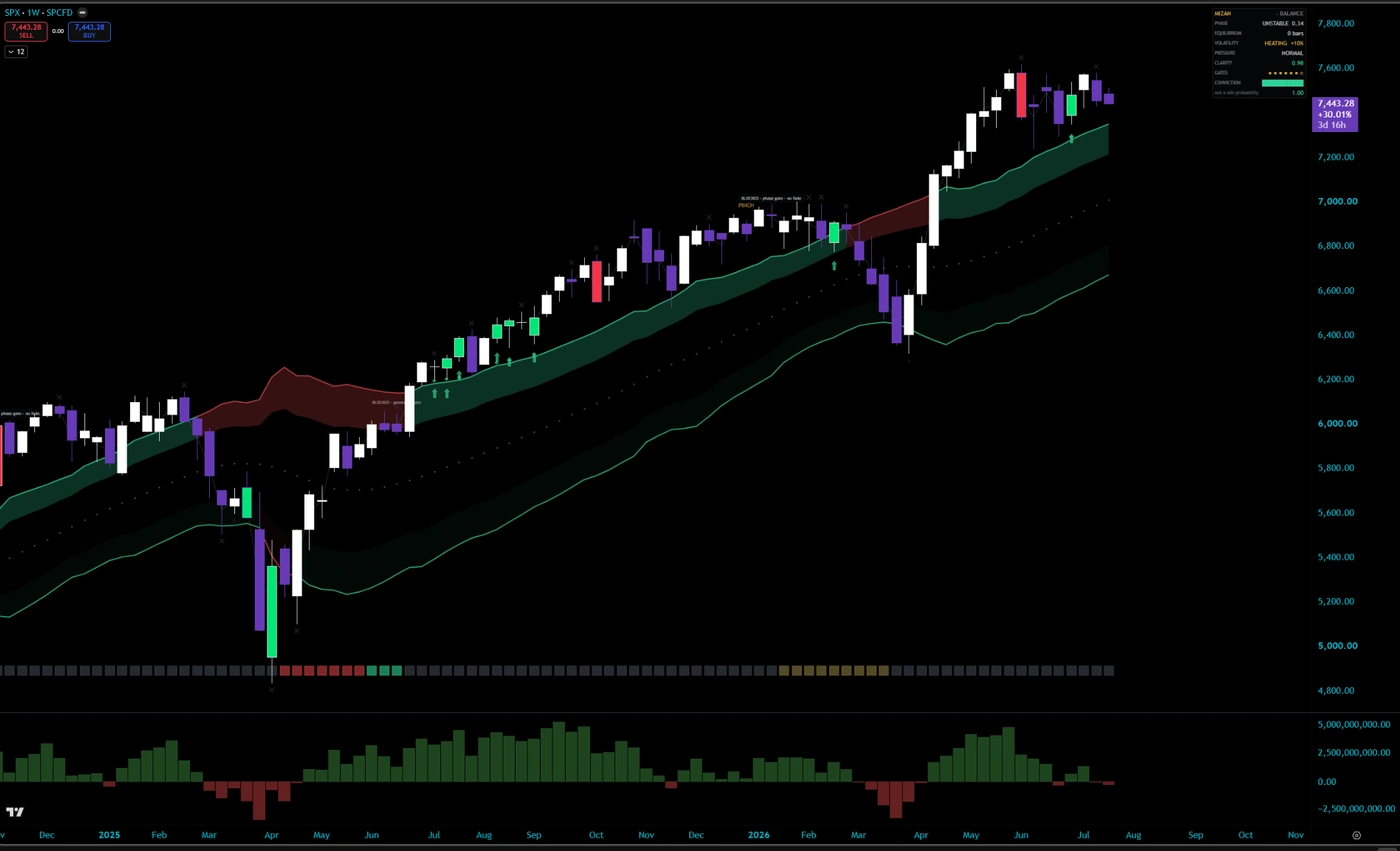
MIZAN on the SPX weekly chart: a year of gradient equilibrium bands, phase ribbon along the chart floor, and the Balance dashboard top right
SPX · 1W · THE LONG READ The same engine that scalps the 1-minute reads the weekly. One logic, every timeframe: the phase ribbon along the floor is the year’s regime in one strip, and the Balance dashboard keeps score in the corner.
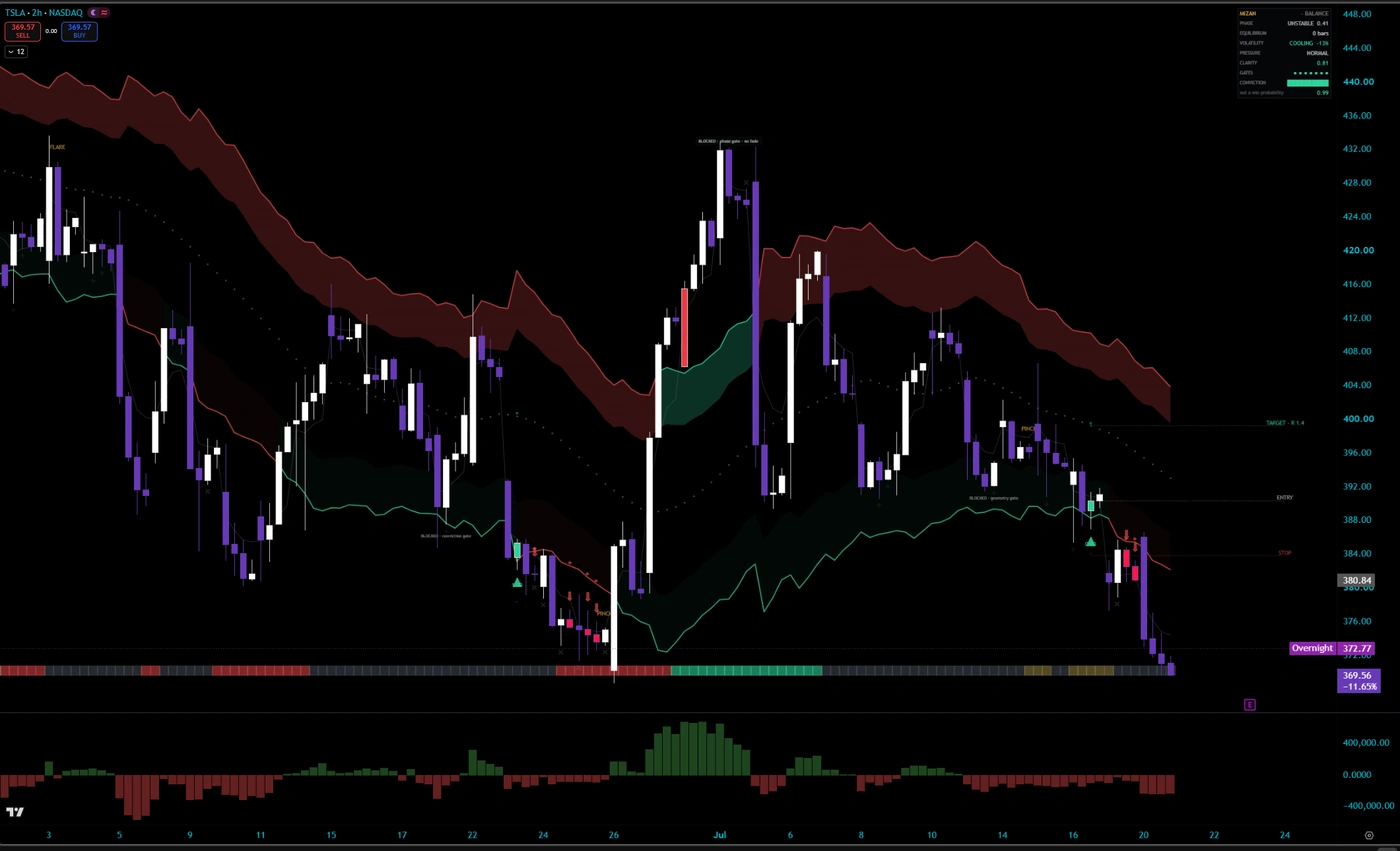
MIZAN on the TSLA 2-hour chart: dark equilibrium bands with a short signal and dotted entry, stop, and target lines showing R 1.4
TSLA · 2h · SWING The engine draws the whole trade before it asks for your capital: entry, stop, and target on dotted rails, R 1.4 on the table. Every mark is accountable to a number — you are never guessing what a mark meant, or what your risk was.
MIZAN on the SPX 5-minute chart through a violent gap open: sparse marks, blocked pills, and stops drawn on the signals it did allow
SPX · 5m · INTRADAY A violent open, shown uncut. The engine refused the chaos candles, and when it did print — a GO LONG among them — every mark carried its stop on the chart: risk defined at the fill, not explained after it. No highlight reel, ever.
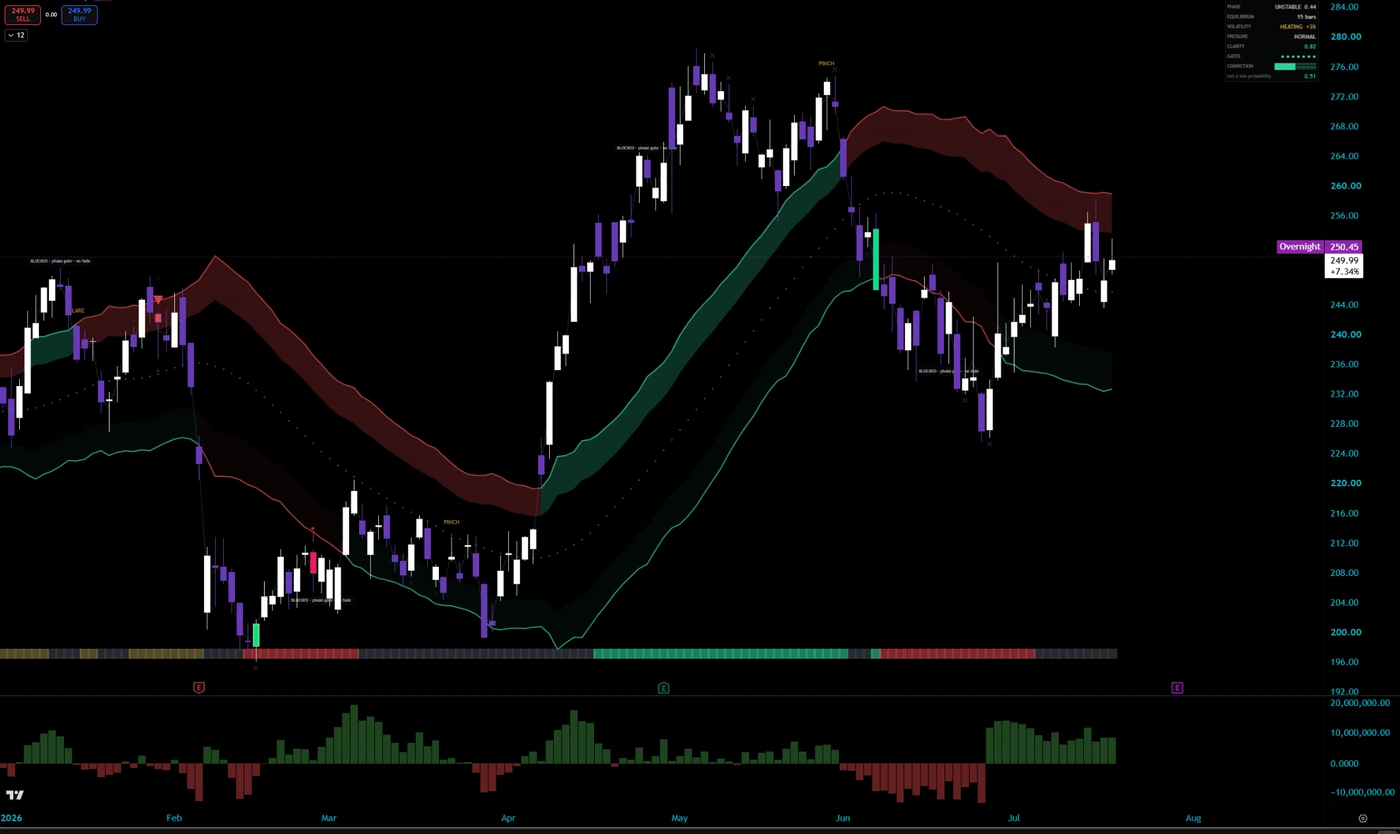
MIZAN on the AMZN daily chart: gradient equilibrium ribbons through a full swing cycle with PINCH compression marks
AMZN · 1D · SWING One engine through a full cycle: descent, compression, reclaim. PINCH flags volatility loading before the turns, and the ribbons recalibrate on their own — the tool that read the downtrend is the same one, untouched, that read the recovery.
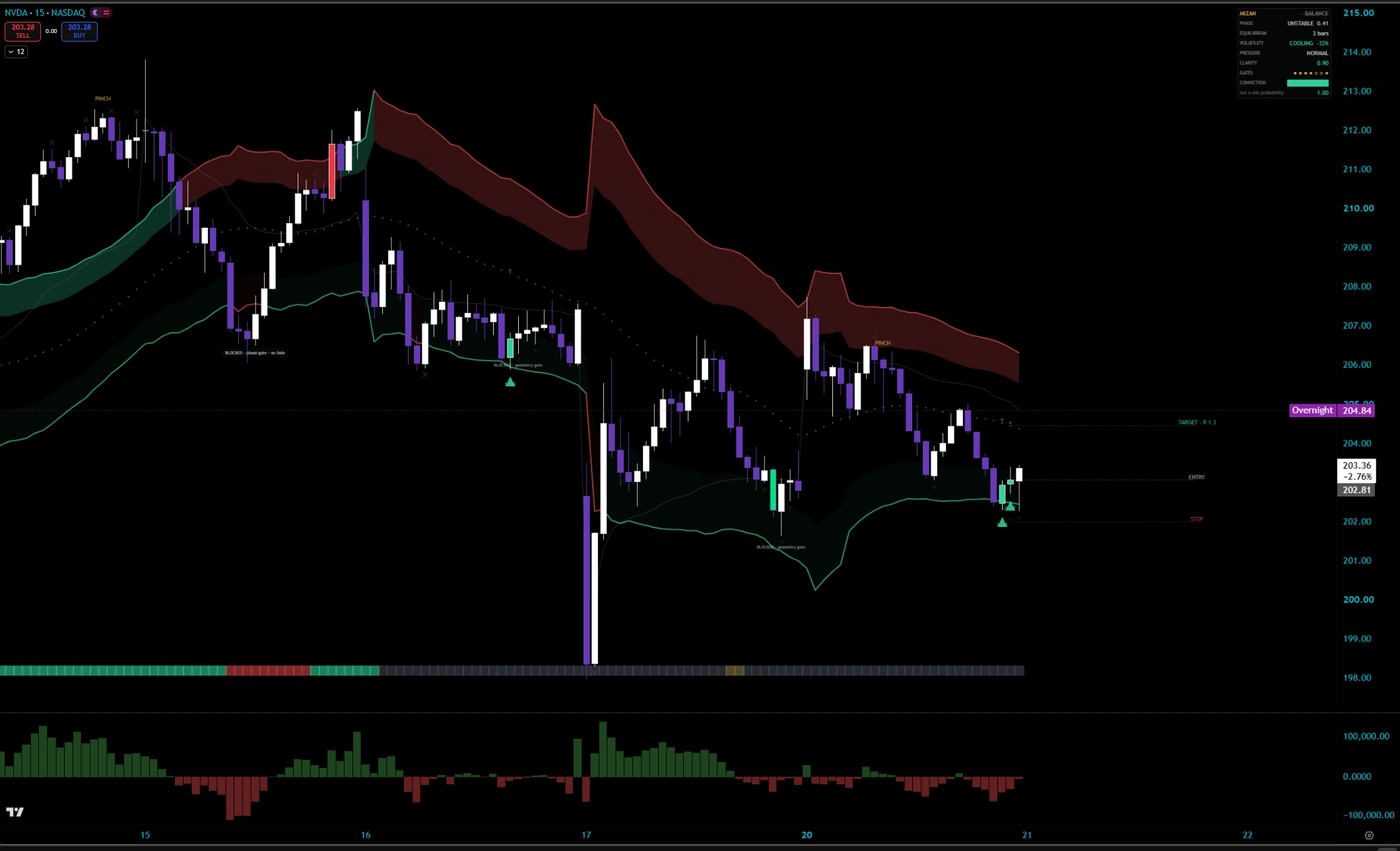
MIZAN on the NVDA 15-minute chart with a long signal, conviction at 1.00 on the dashboard, and live entry, stop, and target rails
NVDA · 15m · INTRADAY This is what full agreement looks like: conviction at 1.00 on the dashboard, and the trade fully drawn — entry, stop, and target rails live on the chart. When every layer confirms, MIZAN doesn’t hint. It commits, in writing.
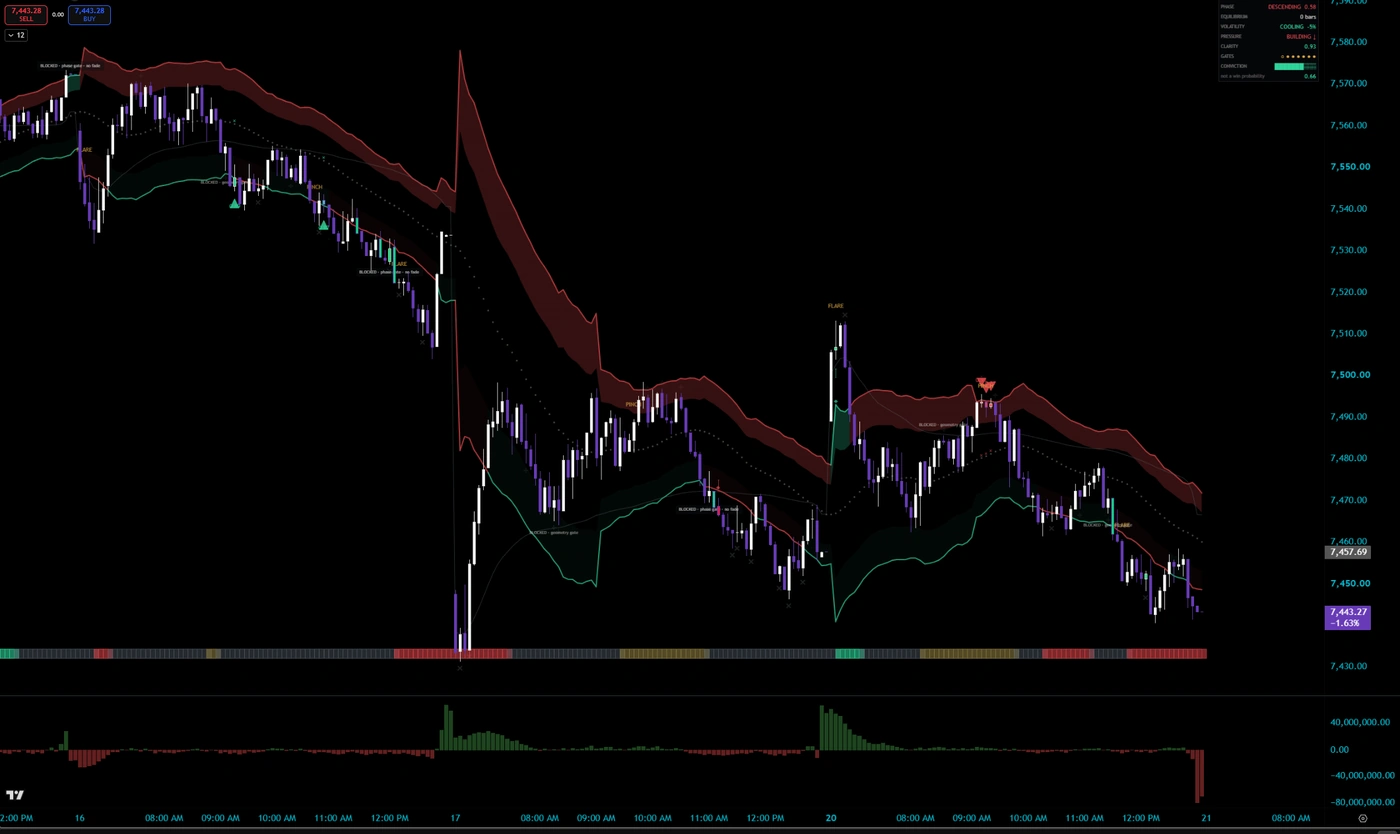
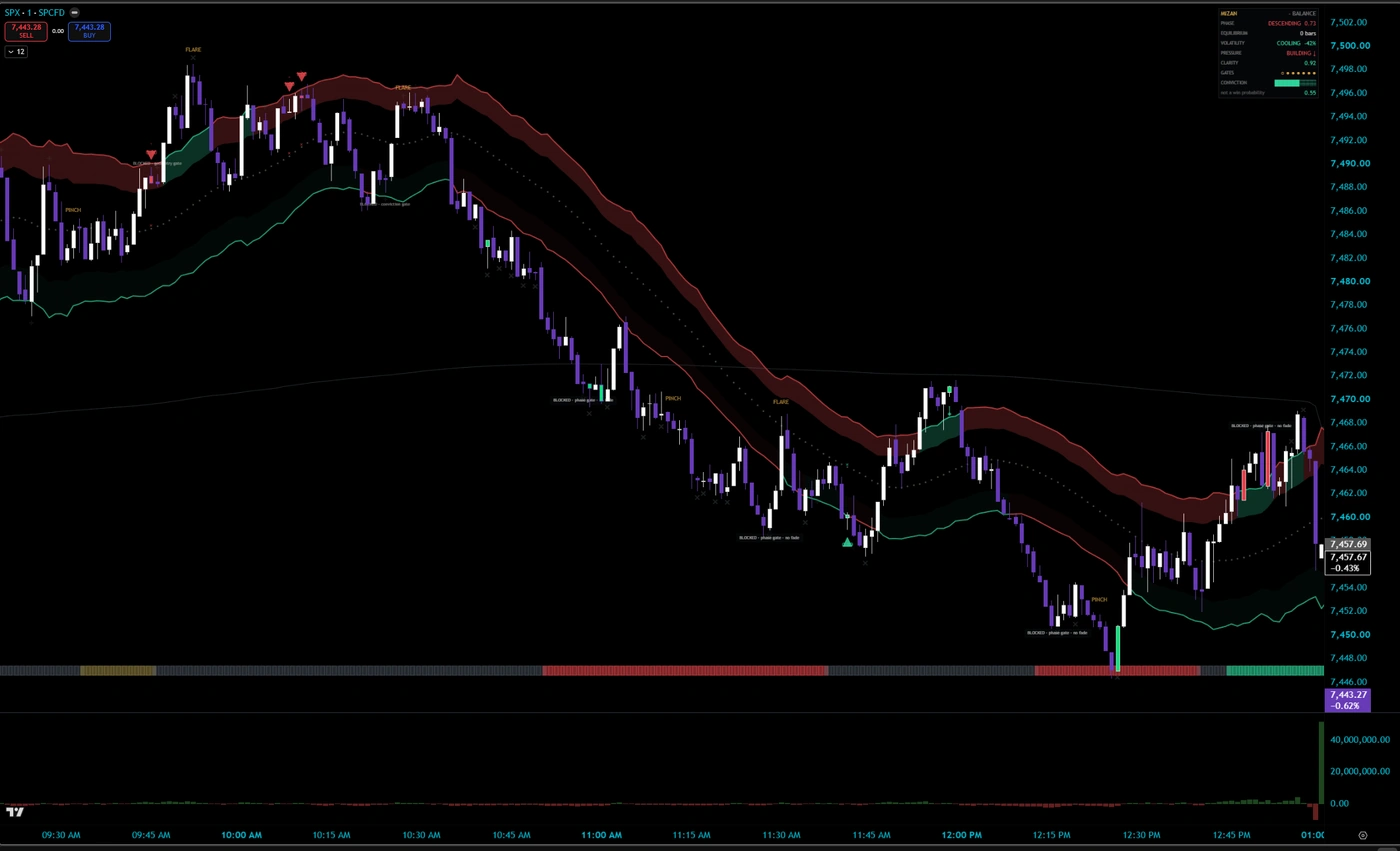
MIZAN on the SPX 1-minute chart: short signals at the morning highs, BLOCKED phase-gate pills on the countertrend fades through the decline, and a long scalp signal at the midday bounce, with the Balance dashboard reading the descent
SPX · 1m · SCALPING Read the whole story. Shorts printed at the highs as FLARE confirmed the rollover; every bargain-hunting fade on the way down got BLOCKED · phase gate; and the one green scalp printed where the bounce actually qualified. The engine traded the bleed and refused the temptation — both halves are the edge.

The trades you won’t take

The gray tags that read BLOCKED are exactly what they say: setups that reached the stack and failed a check, printed on the chart in real time. That is the product working. MIZAN’s edge is not more signals: it is fewer, better ones — and the damage you never take.

The market does not owe you a trade — MIZAN is built to remember that.

Test it on your tape — 7 days free

Cancel anytime · Secure checkout on Whop

← Back to MIZAN
From $99.99/mo · 7-day trial Start Free Trial