Data Visualization & Risk Management

The quantitative risk engine for TradingView.

It reads the market you’re actually in, grades every setup 0–100 on the close, and refuses the ones that haven’t earned your risk.

7 proprietary validation layers.
One score per bar.
Weak setups blocked before they cost you.

  • Not a signal service
  • Not a prediction bot
  • Not an arrow factory

It grades the setup. The call stays yours.

From $99.99/mo · 7-day free trial · No code to install

  • Graded on close — printed signals never move
  • Unedited tape published · losses included
  • 20 free open-source tools — audit the builder before you trust the engine
  • Cancel anytime — no call, no pitch, no retention offer
  • Access is granted by hand, within 24h of signup — not instant, and we say so up front
ENGINE SIMULATION SYNTHETIC TAPE
CONVICTIONphase · expansion
0.78high conviction
weight of evidence, 0–1 · the 0–100 score as the chart prints it · not a win probability, not a forecast

Not a backtest, and not the engine. This is a visual demonstration of the on-chart grammar, running on synthetic tape it deals itself, so every number you see here is generated at random. The real ones are in the unedited sessions.

WATCH A REAL SESSION →
Start here

Three ways to check this before you pay for it.

Everything below argues the case. These three let you verify it yourself instead. None of them ask for an email.

Short on time? The three answers skeptics actually want, straight from the FAQ: what’s the win rate, does it repaint, where it struggles.

Straight to source, no page of ours in between: Elite CVD, volume delta with directional wick attribution · Daily Sweep Pro, liquidity raids with fair value gap entries.

Why most traders lose

Fixed rules. Dynamic markets. That’s the whole problem.

A setup that works beautifully in quiet conditions gets destroyed during expansion, trend acceleration, or a regime change. Retail indicators don’t notice the market shifted underneath them — so they keep firing the same signal into a different game.

BOLLINGER-STYLE BANDS

A single volatility model with a fixed lookback — doing exactly what it was designed to do. It describes dispersion, not regime: it widens and narrows, but it never knows which game is being played. The bands aren’t wrong. Asking them to validate a setup is.

RSI & OSCILLATORS

Overbought at 70, everywhere, forever — a 1978 momentum gauge, honest about momentum and silent about everything else. Pinned in strong trends, noisy in chop. It was never built to score, weigh context, or filter. That was always your job.

MIZAN

A system, not a component. Reads the regime first, fuses multiple volatility models live, scores every setup 0–100 on close, and blocks the weak ones before they ever reach you.

Never on this site

A prediction.

A “win rate.”

A Lamborghini.

A promise.

If you are looking for those, the rest of the internet has you covered.

MIZAN measures. It does not forecast. It blocks. It does not chase. The call stays yours.

One setup, replayed

Watch a bad trade die.

Every tool on the internet shows you its winners. Here is the moment MIZAN is actually built for — the five seconds where most indicators print an arrow.

00 · THE BAIT

Price stretches hard into the upper band. Textbook fade. Every static tool on the chart prints the same arrow it always prints.

01 · THE READ

MIZAN checks the regime first. This is not balance — it is expansion. A fade against acceleration is a different trade than a fade in chop, and only one of them deserves your risk.

02 · THE SCORE

7 checks run on the close. Trend regime fails. Flow says the push has real participation behind it. The setup grades out at 23 of 100.

03 · THE BLOCK

No arrow. A gray chip prints instead BLOCKED · TREND REGIME with the failed check named right on the chart, and a cooldown starts. The chart stays quiet. Quiet is a position too.

04 · THE LEDGER

Setups that do qualify print with their score — and every printed signal is logged. Win rate and average R, computed on your own chart, losses counted conservatively. One toggle. Nobody’s screenshots, including ours.

One replay is an anecdote. The ledger is the evidence.

Fewer signals. Better ones. Accounted for.

Audit trail

Trust is built on the losers a system doesn’t hide.

Every session is published whole. Nothing is cropped, the clock is on screen, the blocked setups are visible, and the losers are counted. This is not marketing; it is a public audit of proprietary models. Screenshots are cheap, which is why the tape runs three-plus hours at a time with the clock on screen. Tap any chart to zoom.

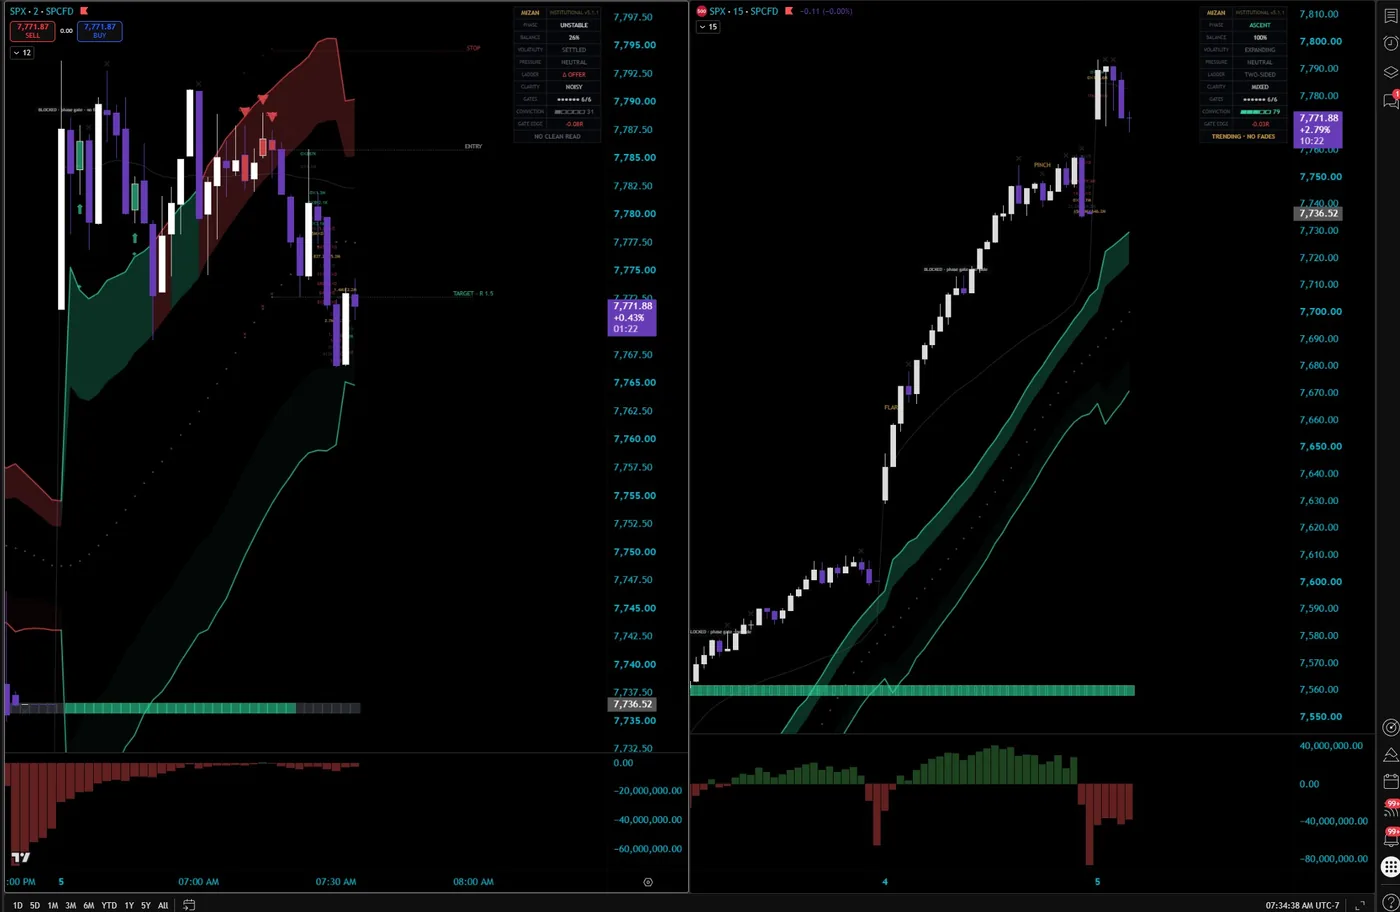
MIZAN running live on a TradingView chart, full unedited session
THE FULL TAPE · 3+ HOURS · UNEDITED A complete live session, start to finish: winners, losers, and the setups it refused. Nothing cropped.
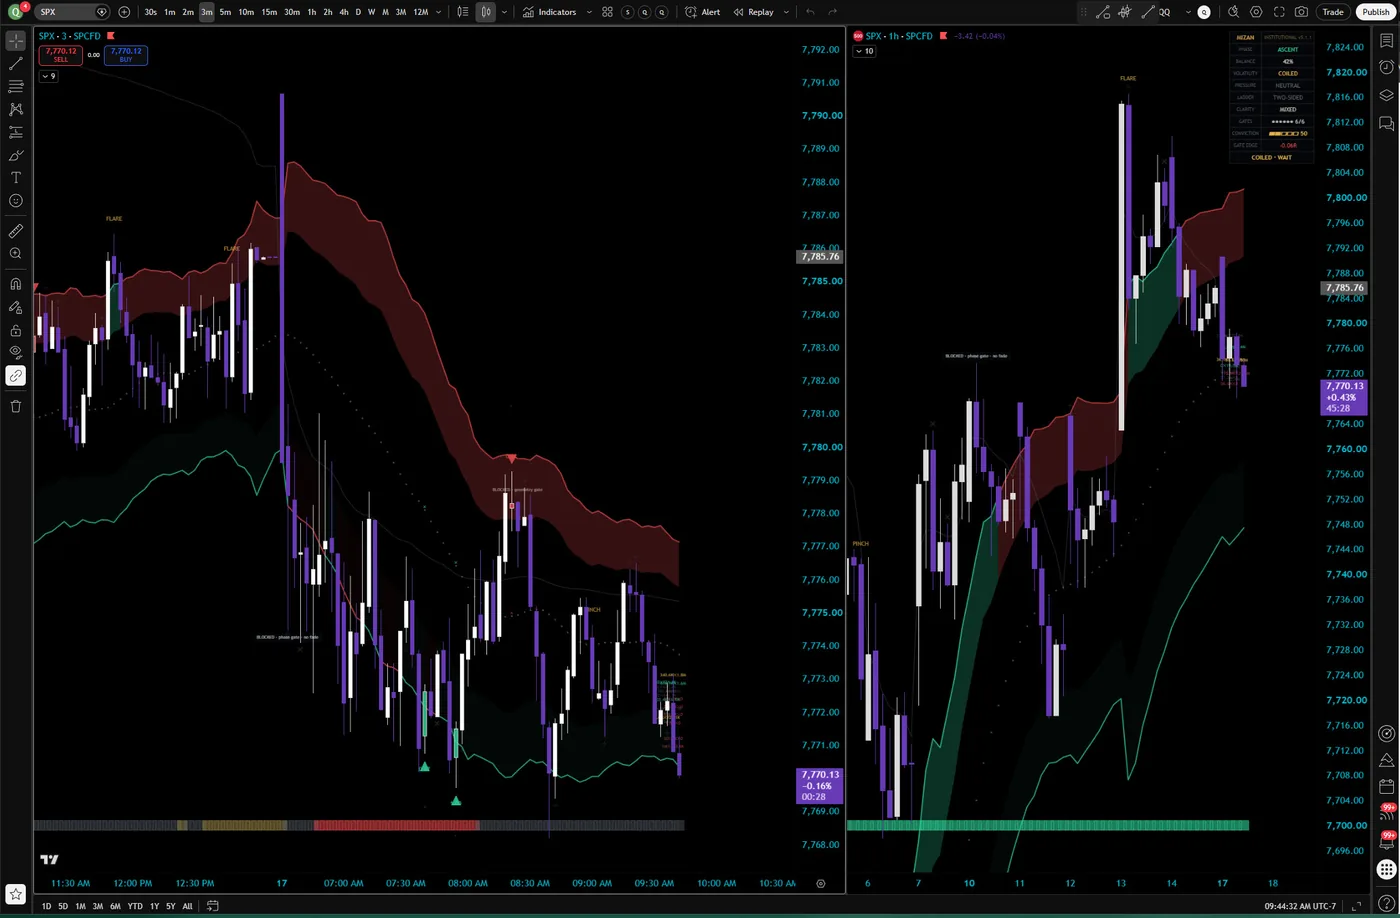
MIZAN running live on a TradingView chart for a six-plus hour unedited session
ONE SITTING · 6+ HOURS · UNEDITED Open to close and then some. Every signal, every refusal, every quiet stretch. Nothing cut.
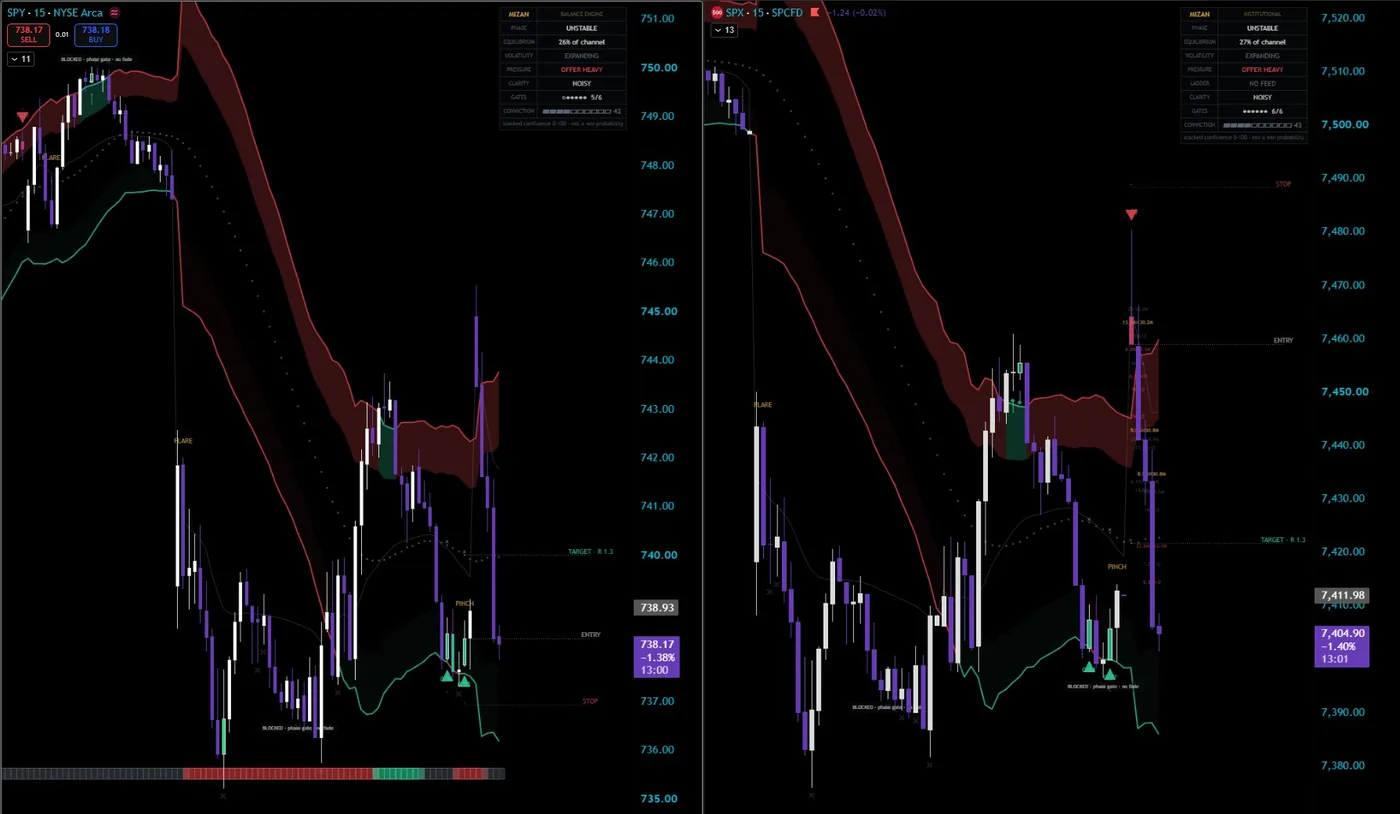
MIZAN Core and Institutional side by side on the SPY and SPX 15-minute charts: the same unstable regime read on both panels, early fades blocked at the phase gate, and the same trade drawn with entry, stop, and a 1.3R target
SPY + SPX · 15m · CORE vs INSTITUTIONAL Same afternoon, two tickers, two tiers. Identical regime read — unstable, offer-heavy — the same early fades blocked at the phase gate, the same trade drawn to a 1.3R target. Institutional layers the auction volume at the level; the verdict engine is identical. The full session is on the chart page.
MIZAN on the AMZN daily chart: gradient equilibrium ribbons through a full swing cycle with PINCH compression marks
AMZN · 1D · SWING Downtrend, compression, reclaim. One engine, untouched settings, through the full cycle. PINCH flagged the loading before each turn.
MIZAN on the NVDA 15-minute chart with a long signal, conviction at 1.00 on the dashboard, and live entry, stop, and target rails
NVDA · 15m · INTRADAY Full agreement: conviction 1.00, trade fully drawn. Entry, stop, and target rails live on the chart.
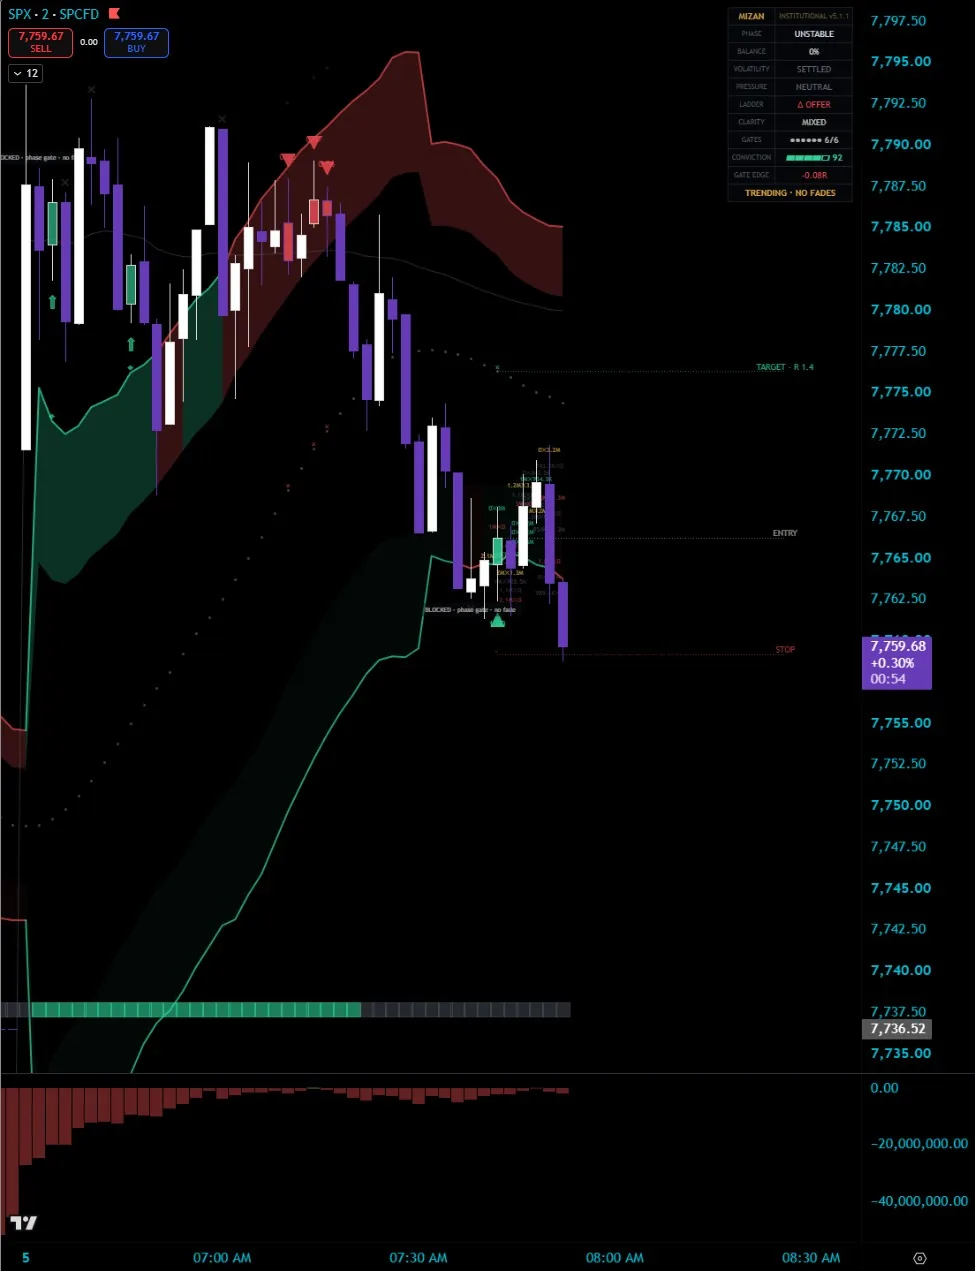
MIZAN on the SPX 1-minute chart: short signals at the morning highs, BLOCKED phase-gate pills on the countertrend fades through the decline, and a long scalp signal at the midday bounce, with the Balance dashboard reading the descent
SPX · 1m · SCALPING Shorts printed at the highs on FLARE. Every fade on the way down: BLOCKED, phase gate. One green scalp where the bounce qualified. Unedited.

The trades you won’t take

The gray tags that read BLOCKED are exactly what they say: setups that reached the stack and failed a check, printed on the chart in real time. That is the product working. MIZAN’s edge is not more signals: it is fewer, better ones — and the damage you never take.

The market does not owe you a trade — MIZAN is built to remember that.

Shown because we publish everything — the losers included. Educational display, not financial advice; trading involves substantial risk of loss, and past performance does not indicate future results.

Test it on your tape — 7 days free

The category, settled

A prediction is a claim about the future. MIZAN only makes claims about now.

WHAT A PREDICTION INDICATOR SAYS

“Price is about to go up. Follow the arrow.” A claim about the future, unverifiable until your money is already in.

WHAT MIZAN SAYS

“On the bar that just closed, the evidence weighs 78 of 100: regime, flow, and structure agree.” A measurement of the present, checkable the moment it prints. The trade stays your call.

A scale never tells you what tomorrow weighs. Neither does MIZAN. It reads what is on the pan right now, prints the number, and blocks the setups that come up light.

For the price-action purist

“I only trade price action.”
Good. So does the engine.

MIZAN doesn’t replace your read — it stress-tests it. Price, volume, and flow are the only inputs. The engine just weighs them on every bar, at machine speed, and holds what your eyes are already trying to hold — without fatigue, without a bias, without a bad night’s sleep.

  • Locked on close. Signals print when the candle closes and never move. The bands adapt; a printed signal is final — losers included, left on the chart.
  • The math you’d do with infinite time. Regime state, multi-timeframe confluence, and flow evidence, scored 0–100 with the reason printed — on every bar of every session.
  • A gate, not a bot. It takes no trades and gives no advice. It sits on top of your process and blocks the setups that don’t earn the risk.

Don’t take the pitch — take the tape. If your eyes beat the gate for 7 days, cancel — you were right, and it cost you nothing.

7 PROPRIETARY CHECKS  ·  0–100 SCORE  ·  ANY MARKET, ANY TIMEFRAME  ·  UNEDITED TAPE PUBLISHED  ·  NO PREDICTIONS
The System

The name is old. The math is new.

Every market is a continuous auction between buyers and sellers. Most of the time price rotates around a temporary fair-value zone where both sides are balanced. The highest-probability opportunities appear when price pushes too far from that balance — and snaps back.

MULTIPLE VOLATILITY MODELS · ONE LIVE WEIGHTING

Adaptive bands. Multiple distinct volatility models run at once. MIZAN weights them live — tightening bands when volatility contracts, widening them when it expands. No static settings to break.

RED BAND

Exhaustion above equilibrium. Potential short.

GREEN BAND

Exhaustion below equilibrium. Potential long.

Signal, balanced with context. Conviction, balanced with confirmation. Opportunity, balanced with risk.

Everything in the middle is noise. Simple to read. Difficult to fake.

Test it on your tape — 7 days free

7-day free trial · Cancel anytime

Intelligence · The 7-Layer Stack

Before a signal appears, it survives 7 proprietary checks.

If conditions are weak, the setup is blocked entirely. MIZAN’s greatest edge is often the trades it prevents.

SETUP 01020304050607 SCORE 0–100 SURFACED BLOCKED
01

Mean-Reversion Validation

regime-conditioned mean-reversion test · adaptive lookback

Confirms whether price historically responds to extension here — or whether momentum continuation is dominating.

Plain EnglishA stretched market is a rubber band. This check asks one question: at this distance, does price usually snap back here, or keep going?

02

Trend Regime Detection

state classification: trend / chop / expansion

Separates directional expansion from sideways chop, so fade setups only fire in favorable environments.

Plain EnglishA trending market marches in one direction. A choppy market bounces inside a box. The same setup means opposite things in each, so MIZAN reads which one you are in first.

03

Smart-Money Flow Analysis

one-sided pressure & aggressive-participation detection

Detects aggressive one-sided pressure and stops you fading institutional momentum blindly.

Plain EnglishIf heavy selling hits every bounce, someone big is unloading. This check stops you from buying the dip into that seller.

04

Adaptive Equilibrium Engine

multi-model volatility fusion · live weighting

A self-correcting balance model that continuously recalibrates the system’s center of gravity.

Plain EnglishThis is the fair-price line the bands hang from. It moves with the market instead of sitting on a fixed setting.

05

Regime-Shift Detection

structural-break identification · signal lockout

Identifies sudden structural transitions and locks signals during unstable behavior.

Plain EnglishNews drops and the tape changes character in seconds. When that happens, signals lock until conditions stabilize.

06

Market Roughness Filter

price-path roughness estimation · noise suppression

Measures how clean or chaotic price action is and cuts the score in noisy conditions.

Plain EnglishSome price action moves like stairs. Some moves like a jackhammer. Jackhammer tape gets a lower score.

07

Dynamic Risk Calibration

per-signal stop & target geometry · R:R gate · failure lockouts

Computes the stop, target, and reward:risk for every setup, blocks trades with no room to be paid, and locks the trigger after a fresh failure at the same level.

Plain EnglishEvery signal comes with its risk already drawn: stop, target, and the R multiple on the chart. No room to be paid? Blocked. Just failed here? Locked out until the tape resets.

The filter is the feature. Fewer signals. Higher conviction. Less damage.

Test it on your tape — 7 days free

Intelligence · The Score It Prints

MIZAN doesn’t blindly print arrows.

Every setup gets a live score from 0–100 measuring alignment across the entire stack. You decide how selective to be — MIZAN handles the filtering.

  • 0–40 — signal blocked, conditions too weak
  • 40–70 — low conviction, wait for confirmation
  • 70–100 — high conviction, stack aligned
EVIDENCE
0.78 conviction
HIGH CONVICTION

The stack is aligned: regime, flow, and equilibrium all confirm. This is the kind of setup MIZAN is built to surface.

Drag to see how the verdict changes.

Intelligence · The Balance Dashboard

Seven rows. Zero methods.

The engine scores 0–100 under the hood; the chart speaks it as a 0–1 conviction. The dashboard reports outcomes — phase, pressure, clarity — and never once names the machinery producing them. That’s deliberate. You get the read; the method stays in the vault.

Signals print as small marks with a 0–1 conviction — hover one and it shows its receipts: which evidence stacked, and the R on the table.

PINCH and FLARE mark volatility compressing and releasing. Entry, stop, and target draw themselves for the latest signal. A phase ribbon runs the chart floor.

One transparency dial fades the entire layer to taste. The chart stays yours; MIZAN is the read on top of it.

From members · Featured
Using MIZAN is like riding the East Australian Current in Finding Nemo. The bands show you exactly where the core flow of the market is. When price drifts outside that channel, you know it’s an anomaly — stretched, and prone to snap back. It stops you from getting chopped up in the noise.
— JOSEPH · FUTURES & OPTIONS TRADER

Member notes are added as they arrive in writing — process over profit claims, always with permission.

Who builds this

One quantitative architect.
No sales team.

Built by Qasim Chowdhry. 15 years in validated systems engineering: federal platforms, utility grids, tier-1 bank infrastructure. Same discipline, pointed at a chart.

Support goes to the same inbox that ships the code, usually answered the same day.

No win-rate screenshots. No profit promises. An engine that would rather show you nothing than show you noise.

Qasim Chowdhry on LinkedIn →
Who it’s for

Built for discipline. Wrong for everyone else.

FOR YOU IF

You already have entries, exits, and risk rules — and you want a second opinion with teeth. The engine reads the regime live, grades every setup on the close, and is willing to tell you no. It runs anywhere TradingView does, 1-minute scalps to daily swings — the proof above is both.

NOT FOR YOU IF

You want an arrow every bar. Grading on the close plus enforced cooldowns means MIZAN is deliberately slower than your impulses — tick-chasers will hate it, by design. You’re shopping for promised returns, which no honest tool can sell you. Or you want a bot: MIZAN scores, you decide.

READS LIVE · GRADES ON CLOSE · ANY MARKET, ANY TIMEFRAME · COOLDOWNS ON PURPOSE

Pricing

Test MIZAN against your own tape.

You’re not buying another arrow, you’re buying the instrument. The full engine at every tier, all seven layers, nothing locked. Institutional adds the order-flow layer: the engine reads TradingView’s native footprint feed and scores what the tape is actually doing at your levels.

The math is boring on purpose: one blocked mistake covers the month. 7 days free means your own tape renders the verdict, not our screenshots. Want to read the manual before you decide? The Operator’s Guide is public.

Static indicators, used aloneMIZAN
SettingsFixed period and threshold, foreverRecalibrates to volatility, trend, and liquidity live
Regime awarenessNone. Same signal in every marketReads the regime first; separate logic for trend and chop
FilteringPrints every arrow7 checks; weak setups blocked and labeled on the chart
OutputAn arrowA conviction read on every mark (0–1, engine-scored 0–100) — hover it for the receipts
OvertradingUp to youCooldowns and lockouts built in
Keeps scoreNever audits itselfTracks every printed signal; shows win rate and average R on your own chart (one toggle), losses counted conservatively

Of course we wrote both columns — it’s our table. Only one of them keeps score on your chart, losses included.

Do not take the table’s word for it. Five of the free tools live on TradingView under my own name, full source, no email: Elite CVD · Daily Sweep Pro · Composite Liquidity Flow · Break Quality · Fulcrum. If the math is wrong you will find it there faster than anywhere on this page.

CORE // FULL ENGINE · MONTHLY

$99.99$99.99 /month

Priced for traders who already know what one overtraded session costs.

Test it on your tape — 7 days free

7-day free trial · Cancel anytime · Secure checkout on Whop · Access within 24h

ANNUAL $999/yr · 2 months free · $83.25/mo effective
choose annual at checkout →

  • Full adaptive equilibrium engine on every market & timeframe
  • All 7 intelligence-stack validation layers
  • Live 0–100 evidence score on every setup
  • Key-level confluence: prior-day levels, VWAP, sweeps, cross-market
  • On-chart performance tracker: win% and average R, counted conservatively
  • Overtrade protection & dynamic risk calibration
  • Real-time alerts and ongoing updates
INSTITUTIONAL // ORDER-FLOW · MONTHLY
$149.99 /month

For traders who want the auction itself — not a proxy of it — scored at their levels.

Test it on your tape — 7 days free

7-day free trial · Cancel anytime · Secure checkout on Whop · Access within 24h

ANNUAL $1,499/yr · 2 months free · $124.92/mo effective
choose annual at checkout →

Native footprint feed requires a TradingView Premium or Ultimate plan — on other plans the engine reconstructs order flow from intrabars automatically.

  • Everything in Core
  • Exchange order-flow engine: TradingView’s native footprint feed, with automatic intrabar reconstruction as fallback
  • On-chart volume ladder: sell✕buy rows on recent bars, POC in gold, imbalances tinted
  • Stacked imbalances, delta conviction, and exchange absorption scored at the bands · Value Area confluence
  • Order-flow fields in every webhook payload — including which data tier fed the signal

Which tier?

Core — the whole engine. All 7 validation layers, conviction scoring, blocked-trade discipline and the public tracker, on every market and timeframe. Nothing locked.

Institutional — the identical verdict engine, handed better evidence: the exchange’s own order flow, read and scored right at your levels.

Start with Core. Move up when you want the tape itself on the stand.

Invite-only by design — the parameters stay private and the logic isn’t for sale. This was never mass-market software.

One blocked bad trade covers the month. Worst case, you spend a week watching it refuse trades you would have regretted.

The engine rewards patience. So does the pricing: pay for ten months, trade twelve.

Something wrong, or access hasn’t landed yet? Email qasim@mizanquant.com — the same inbox that ships the code, usually answered the same day. Billing, cancellation and refunds are handled by Whop, on the terms shown at checkout.

Questions, answered.

What is MIZAN, exactly?

A quantitative risk engine for TradingView, built on advanced quantitative engineering, market microstructure modeling, and adaptive statistical inference. The visualization half redraws your chart into a read you can take in at a glance: who holds the tape, where volatility is loading, which setups qualified. The risk management half is the filter: 7 proprietary checks, a 0–100 evidence score, and a BLOCKED tag on everything that comes up light. It measures and manages; it never predicts.

How is this different from Bollinger Bands or RSI?

Bollinger Bands run a single volatility model with a fixed lookback: they describe dispersion, not regime, and they carry no filter for setup validity. RSI calls 70 overbought in every market, in every condition. Both are single-input, fixed-parameter, and regime-blind: they describe price, and they describe it the same way whether the tape is trending, chopping, or breaking character. MIZAN is a different category of tool. It fuses multiple volatility models live, conditions every check on the current regime, grades the whole setup 0–100 on close, and prints BLOCKED on what doesn’t clear. A scored validation engine, not a line on a chart.

Does MIZAN predict the market?

No, and be suspicious of anything that claims to. MIZAN is a measuring instrument: it weighs the market information on the bar that just closed (volume, momentum, volatility, structure, flow) into one scored read. A thermometer does not promise tomorrow’s weather; MIZAN does not promise the next bar. It tells you when a setup has full confirmation right now and when conditions say stay out. The decision, the sizing, and the risk stay yours.

Where does MIZAN struggle?

Three places, honestly. Thin, illiquid tickers — the volume and flow checks need real participation to mean anything, so stick to liquid names. Scheduled news candles — nothing reads a CPI print mid-bar, which is exactly why the event blackout setting exists; use it. And extended chop — when nothing carries weight, the score stays low and the engine goes quiet. That quiet is not a malfunction. It is the answer.

Does MIZAN repaint?

Signals are confirmed on close. The adaptive bands recalibrate to live conditions, but a printed, validated setup is final — MIZAN is designed so you can trust what you see. Repainting is when an indicator quietly redraws its own arrows after the fact, so its history looks smarter than it was. MIZAN signals print when the candle closes and never move.

What’s the win rate?

We don’t publish one. A win rate without the R behind it is a marketing number — a 90% winner can still lose money, and a 40% winner can print. What MIZAN gives you instead is a ledger on your own chart: every printed signal tracked, win rate and average R computed on your tape, losses counted conservatively, one toggle. If a number is going to convince you, let it be yours.

What happens if I cancel?

You cancel inside Whop — one button, no email to write, no call, no retention offer. Billing, cancellation and refunds are handled by Whop on the terms shown at checkout. Cancel inside the 7-day trial and you are never charged at all. After that the subscription simply stops renewing, and the invite comes off your TradingView username when the period you already paid for ends. The free tools stay yours either way — they are open source and were never gated.

How do I get access after subscribing?

Access is granted to your TradingView username within 24 hours of subscribing, and the engine appears in your invite-only scripts. Works with any TradingView account; once it shows up, add it to any chart. MIZAN is sold only at mizanquant.com, with checkout on Whop — no other site or seller is authorized.

What do the two tiers cost — and why?

Core is $99.99 a month: the full engine, all seven layers, nothing locked. Institutional is $149.99 and adds the order-flow layer — MIZAN reads TradingView’s native footprint feed, draws the volume ladder on the chart, and scores stacked imbalances, delta conviction, and absorption right at the bands. The native feed requires a TradingView Premium or Ultimate plan; on other plans the engine reconstructs order flow from intrabars automatically, so nothing goes dark. Either way the math is the same: if MIZAN keeps you out of a handful of bad trades a month, it has paid for itself, and the 7-day trial exists so you can check that against your own tape first.

Stop buying predictions. Start weighing evidence.

Let MIZAN read the regime, score the setup, and block the noise — so you only take the trades worth taking.

Test it on your tape — 7 days free

New: MIZAN Institutional puts the exchange order-flow ladder on your chart — same engine, eyes on the actual tape.

7-day free trial · Cancel anytime

Worst case, you spend a week watching it refuse trades you would have regretted.

From $99.99/mo · 7-day trial Start Free Trial