Dual-Tape Pressure
AsksAre ES and NQ telling the same story?
Compares estimated buying and selling pressure across two instruments and two timeframes.
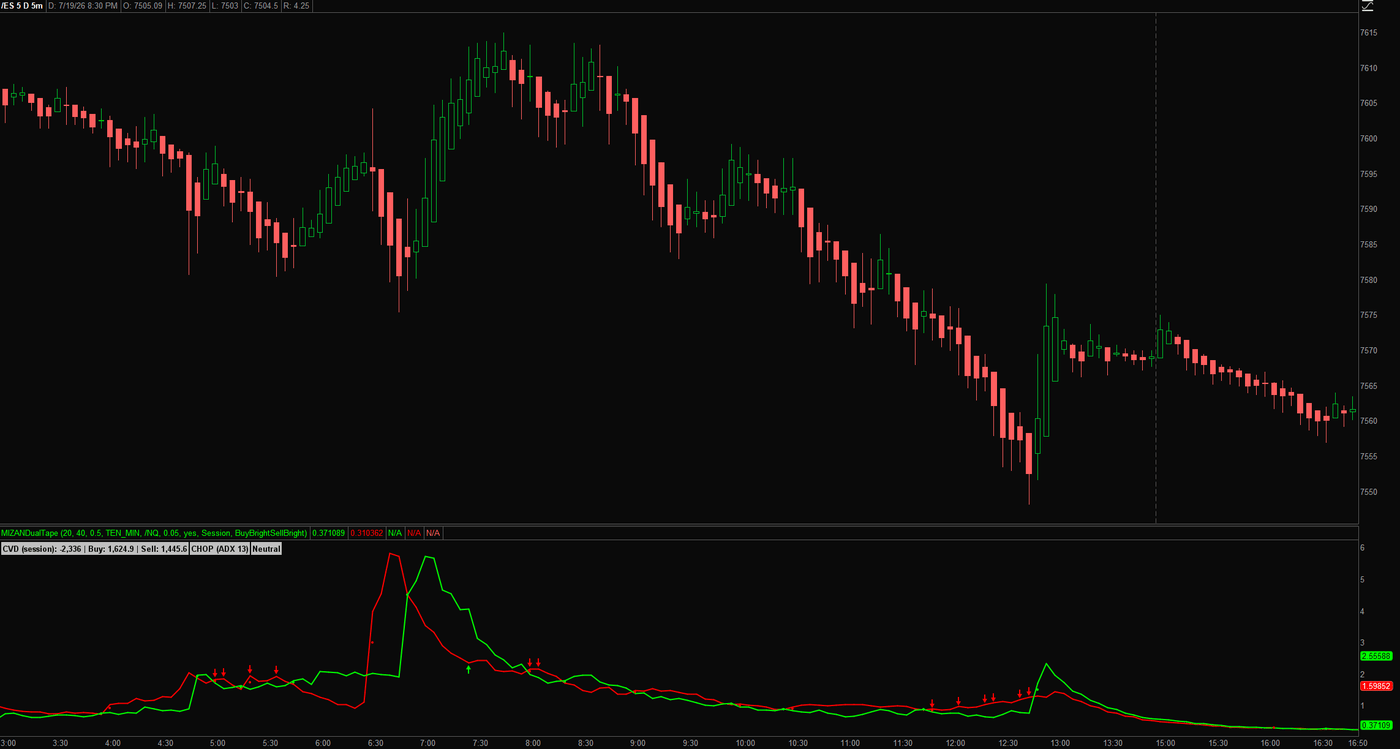
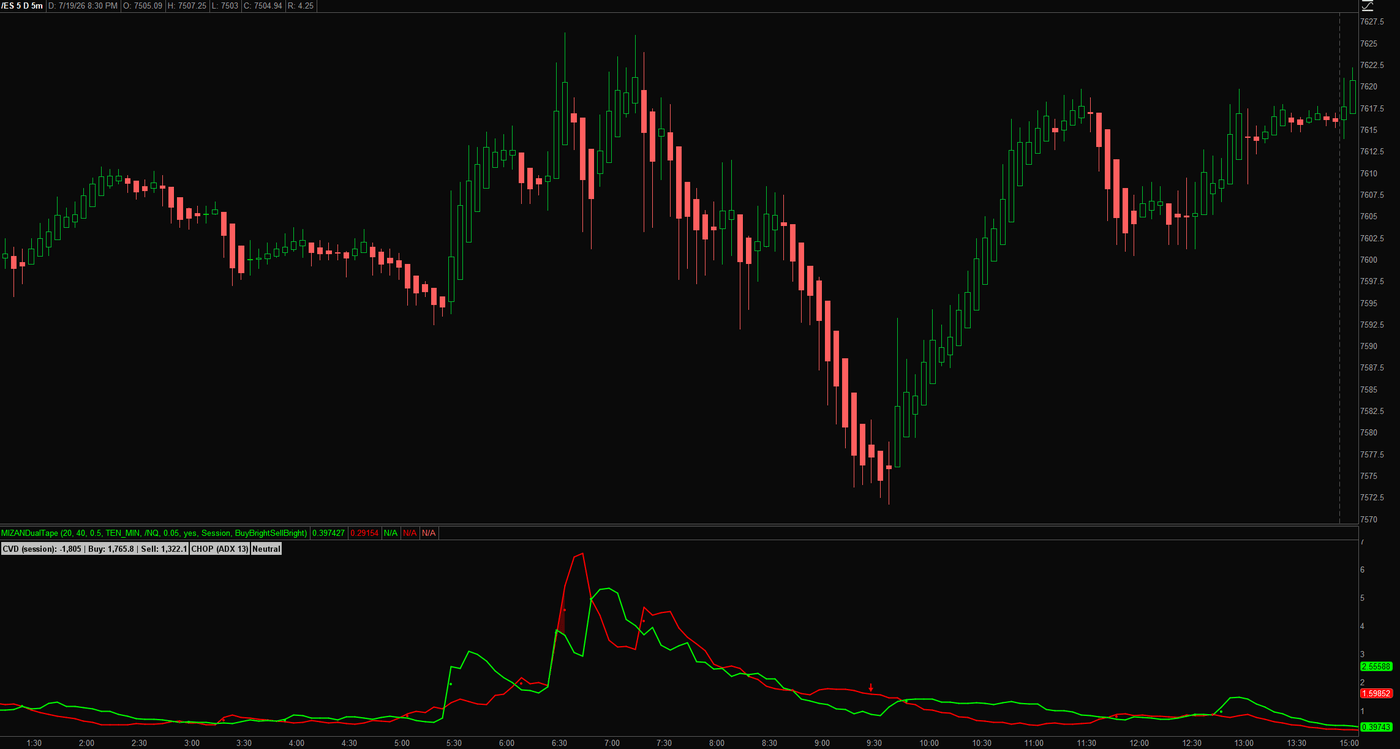
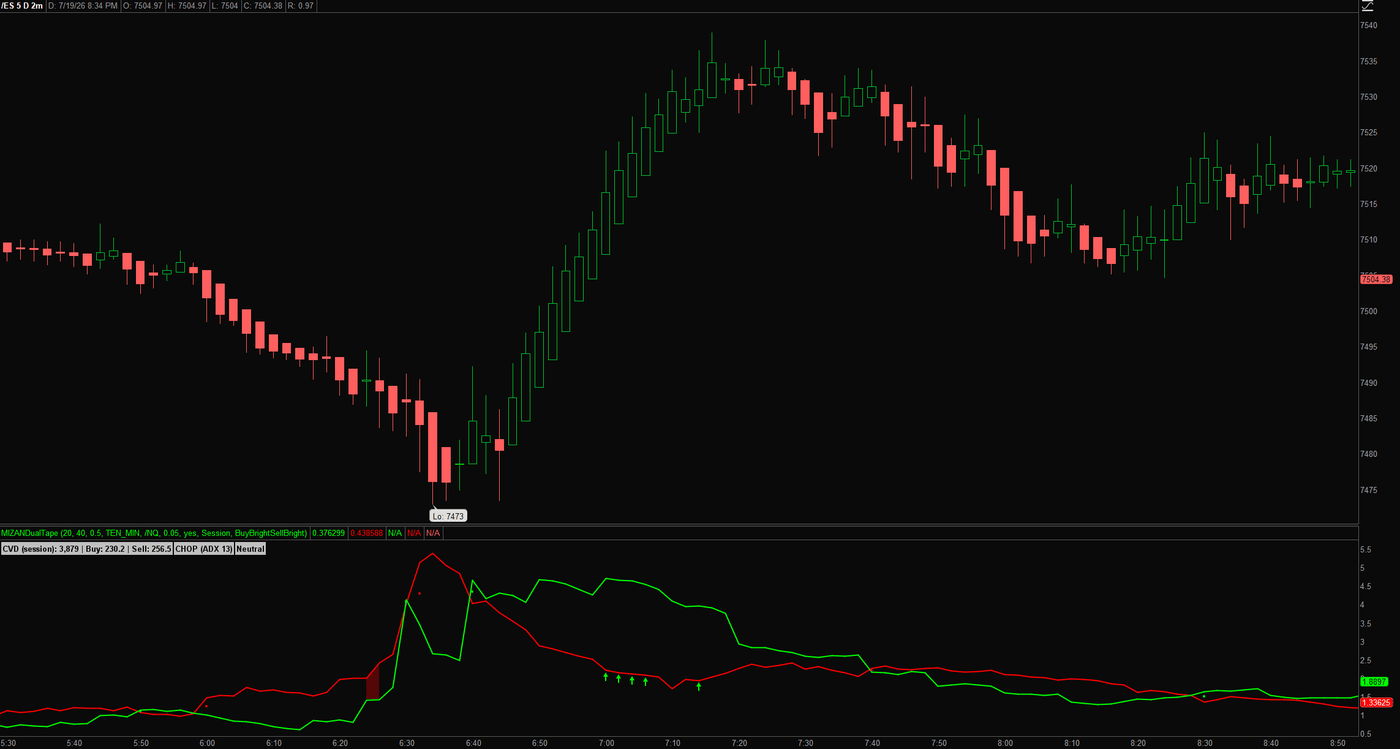
What it measures and how
Dual-Tape Pressure combines a chart symbol and a second instrument across the chart and selected higher timeframe. It compares volatility-adjusted pressure, checks directional agreement, and adds an ADX trend gate before assigning a long, short, or neutral bias.
Get started
- Install the full downloaded script as a new thinkorswim desktop study through Charts → Studies → Edit Studies → Create.
- Choose the chart symbol and verify secondarySymbol. The second symbol defaults to /NQ; the first leg always uses the chart you opened.
- Choose a supported higherTimeframe at least as large as the chart aggregation, and confirm that both symbols have the required price and volume data.
- Read the pressure lines together with the TREND or CHOP label and final bias. Use normalizeLegs to compare the legs against their individual baselines.
- Check whether cvdAnchor is Session or Cumulative before comparing the displayed CVD across chart reloads or dates.
How to read it
Four readings must agreeThe chart symbol and second symbol each contribute pressure-momentum conditions on two timeframes. A directional marker also requires the chart symbol's higher-timeframe ADX direction and its chart-timeframe dominance test.
The lines and the gate differThe green and red lines average the four pressure readings. Their crossing gets a dot, but that crossing alone does not satisfy every condition needed for a directional arrow. normalizeLegs rescales these lines without changing the arrow conditions. The cloud follows scenarioPriority: by default, both adjusted buy and sell pressure on the chart symbol must be increasing for it to appear. Green means the combined buy line is higher; red means the sell line is higher.
What CVD measures hereThe script assigns the chart bar's volume to the up side when its close rises from the prior close and to the down side when it falls. It accumulates that signed volume; unchanged closes contribute zero. Session mode resets when the script's day changes.
Know the limits
Pressure and CVD are price-and-volume proxies. They do not use transaction-level bid/ask aggressor data or a footprint feed.
Active chart and higher-timeframe bars can change the conditions before they close. The script does not include a completed-bar confirmation gate.
Missing secondary-symbol data can prevent a useful read. Session CVD uses a day-change reset, which may differ from the trading session boundary you expect.
Open source, no email wall. Read the code, test it on your own chart, and keep it. Explore all 20 free tools.
Keep the tool.
Add a second read.
Dual-Tape Pressure compares estimated pressure across two instruments and timeframes. Keep that focused view.
The paid MIZAN engine runs on TradingView. It adds the market read, the score and explained blocked setups for the candidates it detects. Reversal setups that pass get entry, stop and target references.
MIZAN is a separate engine, not a bundle of these free tools. Compare its read with your own method.
See passed setups, blocked setups and losses →
7-day trial starts at checkout · From $79.99/month afterward · Cancel through Whop · Manual access within six hours after checkout and receipt of your correct TradingView username