Exhibit A
AsksWhere did the last breakout build its case?
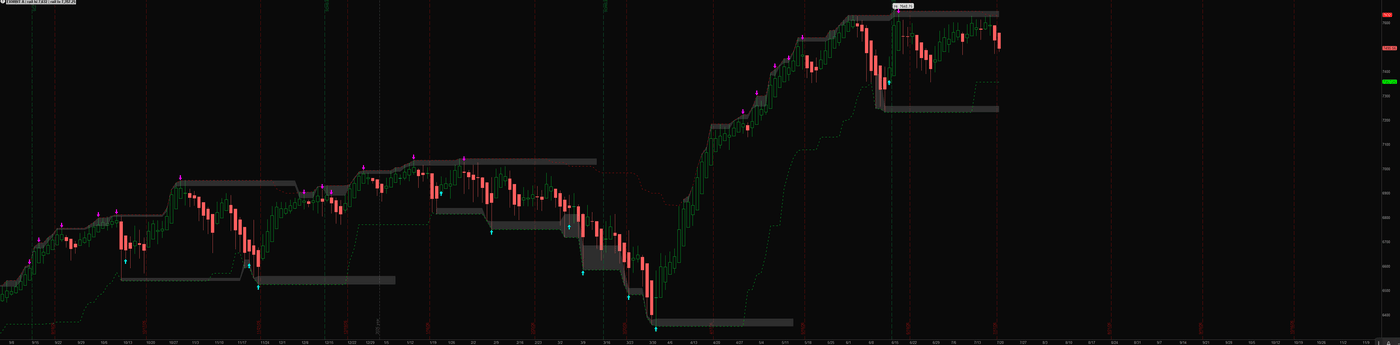
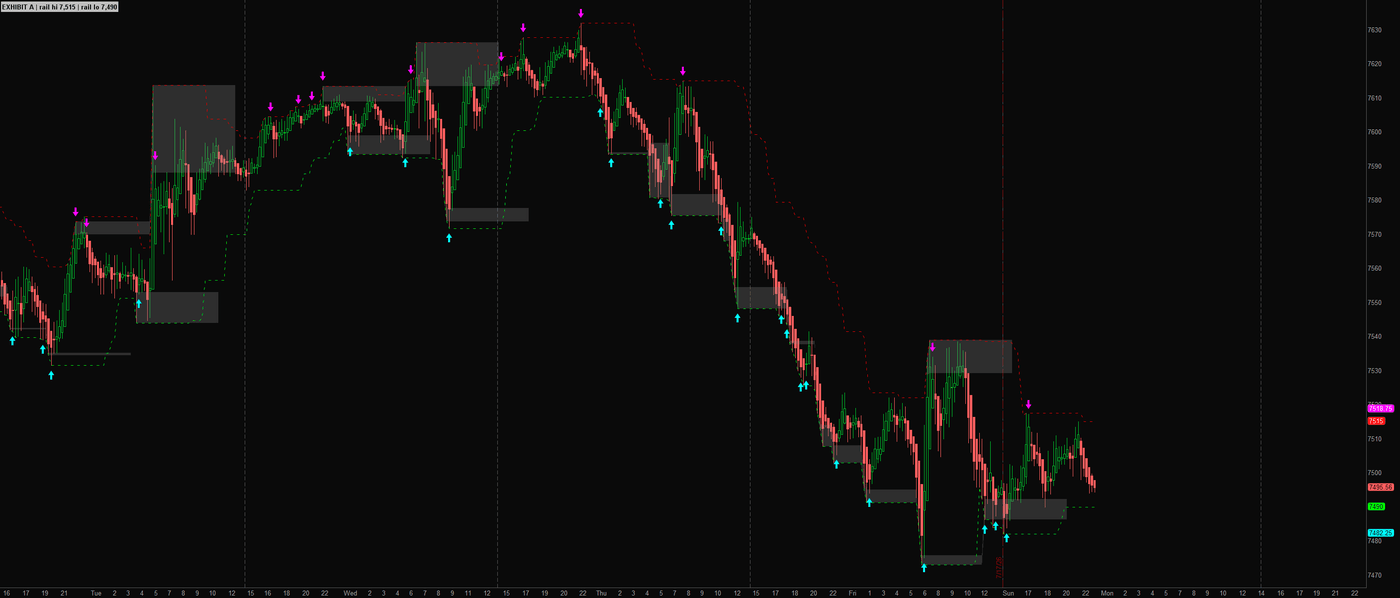
Draws recent highs, lows and candle zones, with markers for selected responses after a level violation.
What it measures and how
Price-action structure, entered into evidence. Exhibit A draws the rolling high and low as stepped rails and shades the wick-to-body area when price sets a sufficiently large new extreme. Response markers highlight a bullish or bearish candle immediately after a rail violation, using the updated rail as their reference.
Get started
- Paste the complete downloaded script into a new study through Charts → Studies → Edit Studies → Create in thinkorswim desktop, then apply it to the price chart.
- Start with the dashed upper and lower rails. They show the highest high and lowest low in the selected swing window.
- Inspect a gray zone's originating candle. The upper zone spans its upper wick; the lower zone spans its lower wick.
- Read cyan and magenta reclaim markers alongside the preceding rail violation, then wait for the active candle to finish before evaluating its closing position.
How to read it
Rolling evidenceThe rails update with the rolling window. A new extreme must exceed the prior rail by the significance percentage before it stamps a fresh zone.
Where the zone comes fromAn upper zone runs from the greater of open or close to the high; a lower zone runs from the low to the lesser of open or close. The most recent zone on each side remains shaded for the configured duration unless replaced.
The response after a violationAfter a lower-rail violation, an upward marker requires the next candle to be bullish and close above the updated lower rail. The downward pattern is mirrored. This does not require a return through the rail that existed before the violation. Arming flags limit repeated prints.
Know the limits
The marker conditions inspect the active candle's close value; the script does not wait automatically for a completed bar. A live marker can change before the candle finishes.
Rails are rolling extremes, so they can move when an old high or low leaves the lookback window. They are not permanently fixed pivot levels.
Gray zones describe candle structure. They do not measure resting orders or prove that a future revisit will hold.
Open source, no email wall. Read the code, test it on your own chart, and keep it. Explore all 20 free tools.
Keep the tool.
Add a second read.
Exhibit A marks price structure and selected responses after a level violation. Keep that focused view.
The paid MIZAN engine runs on TradingView. It adds the market read, the score and explained blocked setups for the candidates it detects. Reversal setups that pass get entry, stop and target references.
MIZAN is a separate engine, not a bundle of these free tools. Compare its read with your own method.
See passed setups, blocked setups and losses →
7-day trial starts at checkout · From $79.99/month afterward · Cancel through Whop · Manual access within six hours after checkout and receipt of your correct TradingView username