How to use MIZAN.
Read the status. Check the score. Review the risk. Start here, then use the chart examples when you need them.
Offline guide v315, dated 14 September 2026, with setup instructions and historical chart examples. This web guide is the current reference. Not a member yet? Start the 7-day free trial →
00 · Your first five minutes
One familiar chart. Three things to read. No twenty-tab initiation ceremony.
- Add your edition. After access is granted, open TradingView, choose Indicators, then Invite-only scripts. Add the edition named in your access confirmation.
- Use a familiar candlestick chart. Choose the stock, index, futures, forex or crypto chart you already follow, at your usual timeframe. Check data availability and active session filters. Synthetic chart types require separate interpretation.
- Check the preset; keep your settings. A fresh Core v5.1.4 instance defaults to Aggressive; Institutional v5.2.4 to Balanced. Saved layouts may differ. Keep Confirm Signals on Bar Close enabled for this walkthrough.
- Compare three historical examples. Open a passed setup, a blocked setup, and a loss. Read the status first, then the score and risk. On your own chart, review earlier loaded bars to learn the labels, then observe the current market read. Historical review is not proof of live availability or future results. A quiet chart is not a reason to force a trade.
1. Status
Confirmed, waiting, or blocked? Read this before the number. A high score cannot override a failed check.
2. Score
The score summarizes evidence on a 0–100 scale. Older chart labels may show 0.78 for 78/100. Neither means a 78% chance of winning.
3. Risk
For a reversal, read entry, stop, and target together. These are chart references; MIZAN does not place or block broker orders.
Keep a simple record during the trial and your weekly review →
The operating instructions below cover Core v5.1.4 and Institutional v5.2.4. Core v5.1.5 and Institutional v5.2.6 display scores out of 100, including compact labels. Check the version on your chart; historical screenshots may show decimal scores.
Find the right script. The source titles are Mizan: adaptive equilibrium engine with refusal tracking and Mizan Institutional: intrabar footprint order-flow engine. Use your access confirmation if its listing title differs.
01 · The one idea
MIZAN checks the setups it detects on your TradingView chart. It reads market conditions, scores reversal evidence, and shows whether the setup passes its checks.
The score describes the evidence. The status tells you whether the setup passed. A confirmed signal can still lose. A blocked setup can still move in the expected direction.
You decide whether to trade. MIZAN does not execute orders, enforce account limits, or know your financial situation.
The methodology explains the underlying approach. The score guide explains what the number can and cannot tell you.
02 · The bands, without the guesswork
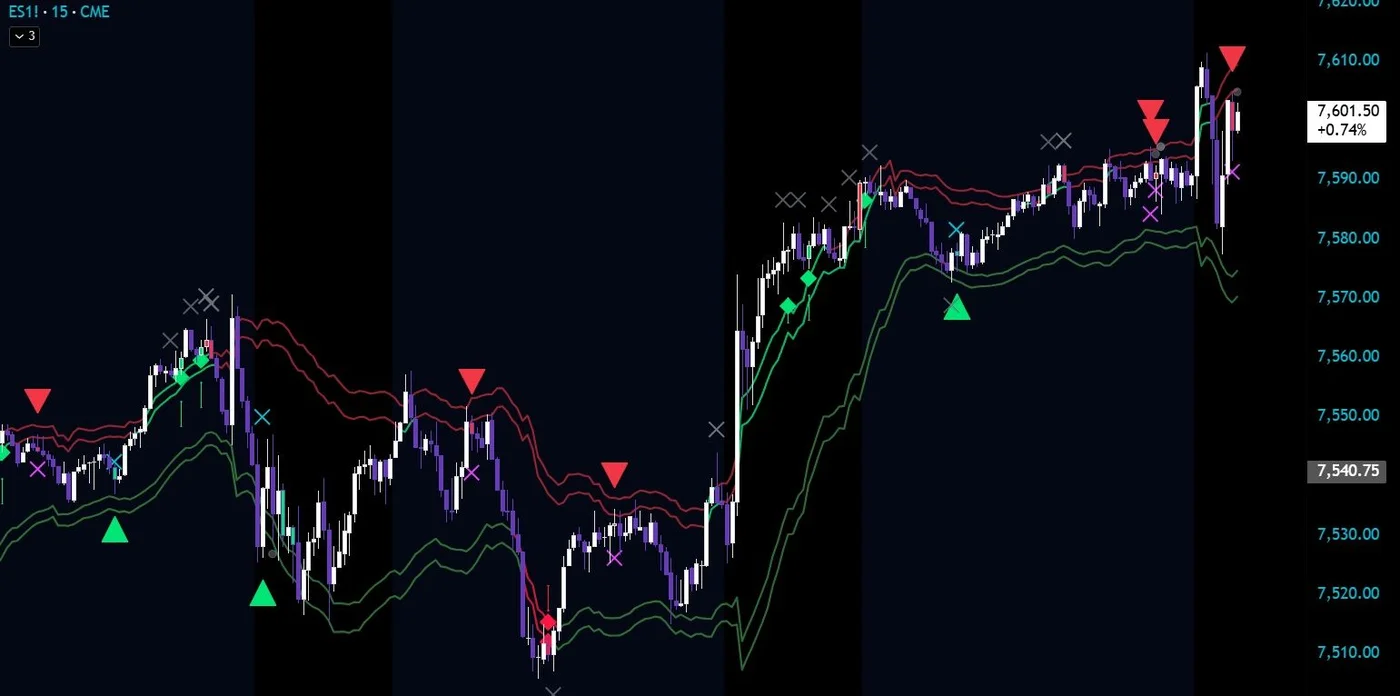
The bands describe the engine’s estimated balance area. Price near a band can become a reversal candidate when the other pattern requirements are present. Touching a line alone is not a signal.
Read one reversal
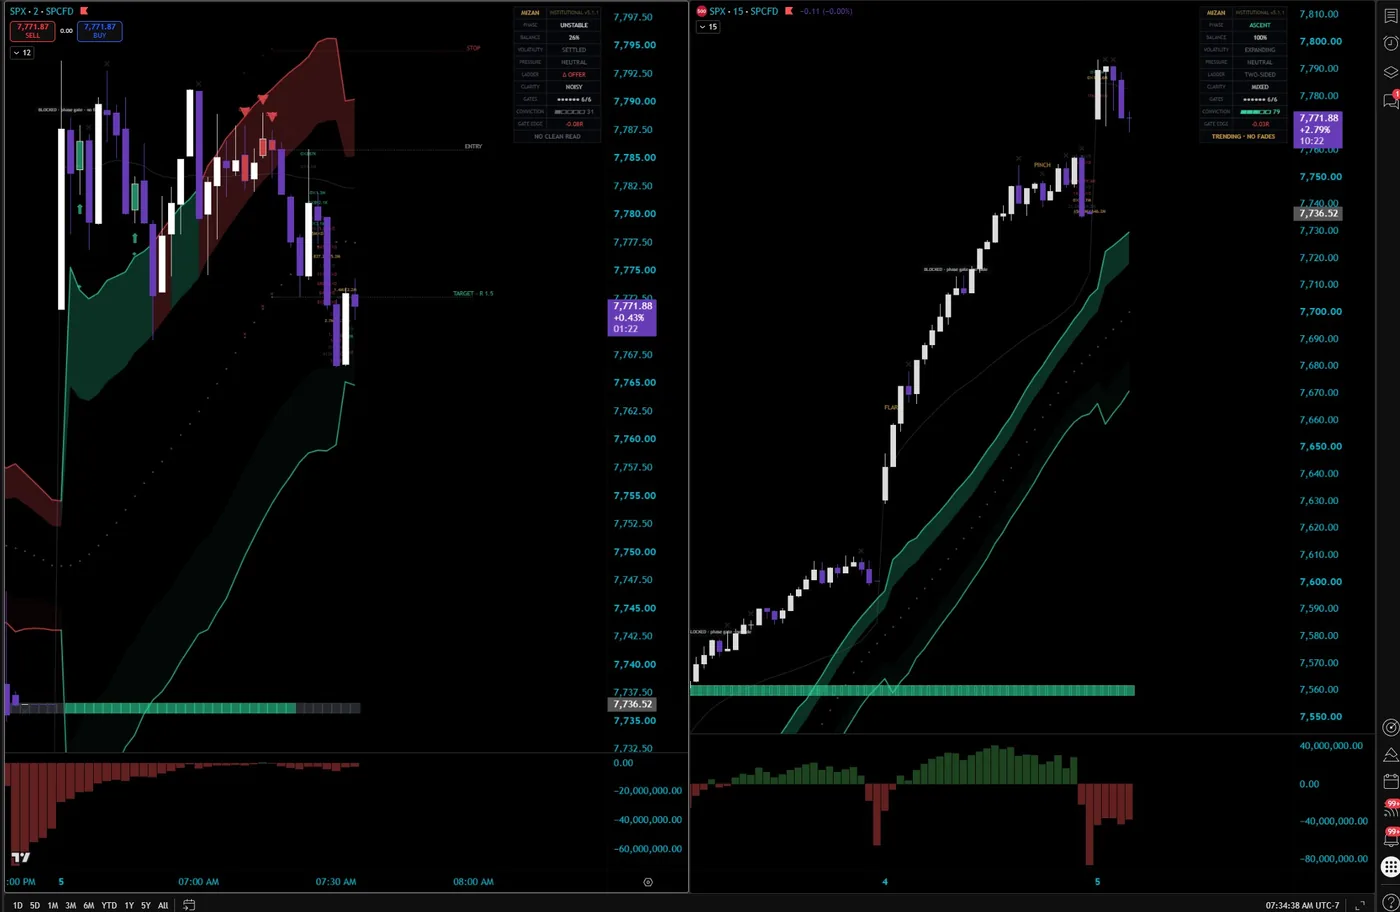
Wait for confirmation. With bar-close confirmation enabled, read the mark after the candle closes. Forming-bar values can change.
Check the status and score. A high score still needs the other requirements to pass. A blocked label names a failed check; several checks can fail at once.
Review the three levels. Entry, stop, and target describe the confirmed reversal. Compare the proposed risk with your own rules before deciding anything.
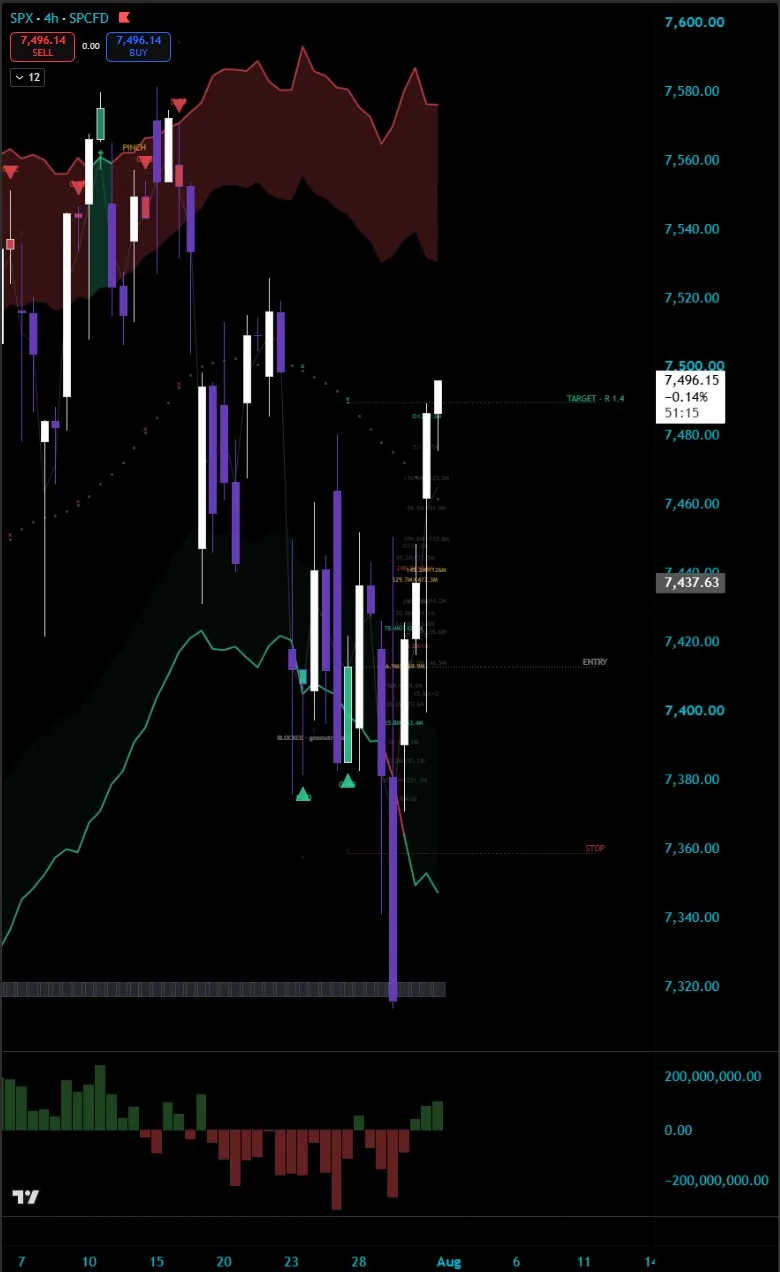
The chart’s dotted levels can belong to an earlier confirmed signal. The current panel describes the latest bar. Neither means an old setup is still active.
03 · Reading the marks
Start with the mark’s type. A reversal and a continuation do not carry the same information.
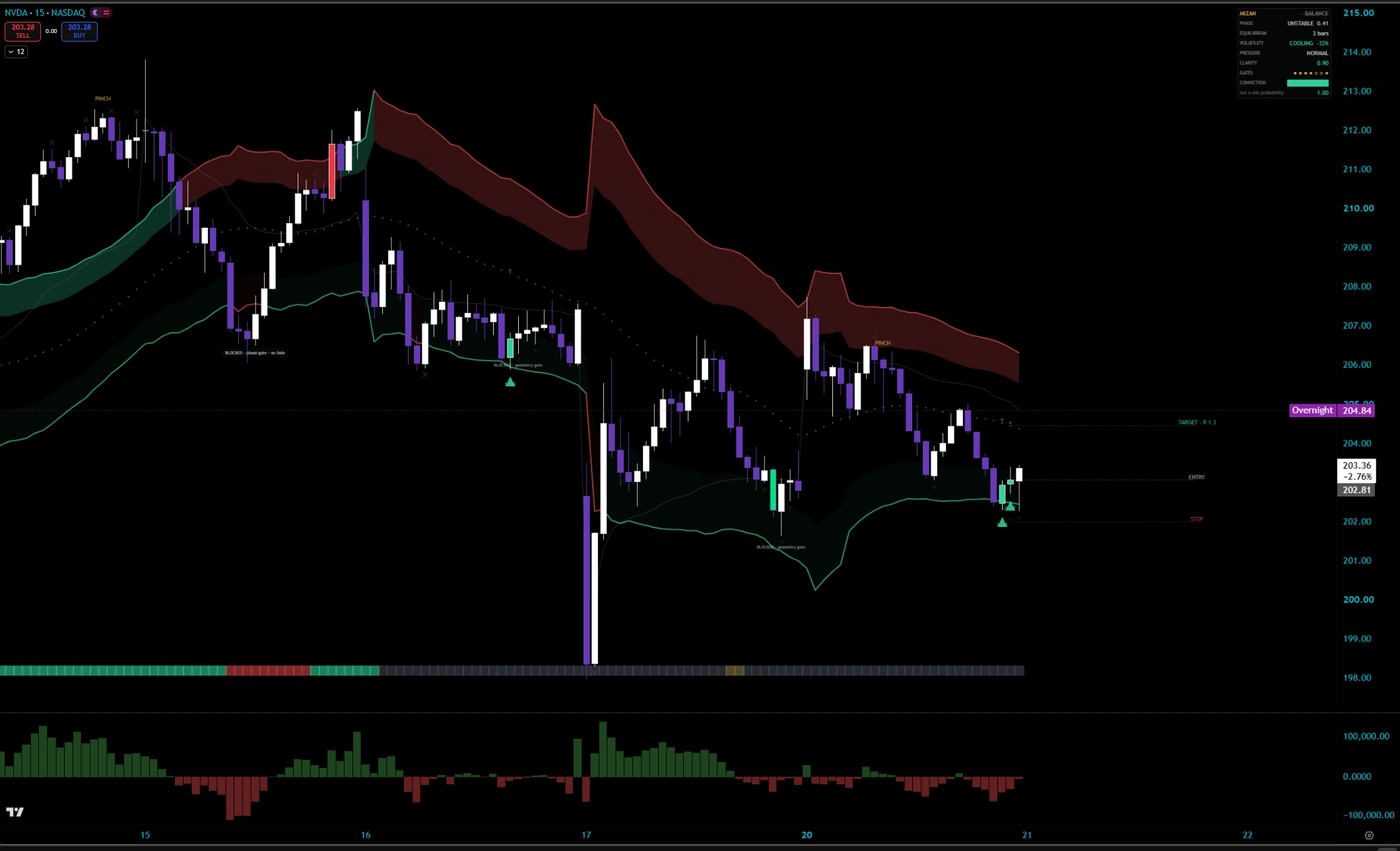
- Triangle + number A reversal signal with its score. Older compact labels use a decimal: 0.78 corresponds to 78/100. Core v5.1.5 and Institutional v5.2.6 show the number out of 100. It is not a success probability.
- Three dotted lines Entry, stop, and target references for the latest printed reversal, with its reward/risk ratio. Match them to that signal’s time.
- Blocked cross or label A candidate failed a requirement. Read the label and Status row; score, market conditions, session, or risk can be the reason.
- Small circle A direction lockout after a recent failed signal. Check Status for the current reason rather than assuming every quiet bar is locked out.
- Continuation arrow A pullback into a band that changed role. Continuations provide a target only, without a reversal score or defined continuation stop. They are excluded from the reversal ledger.
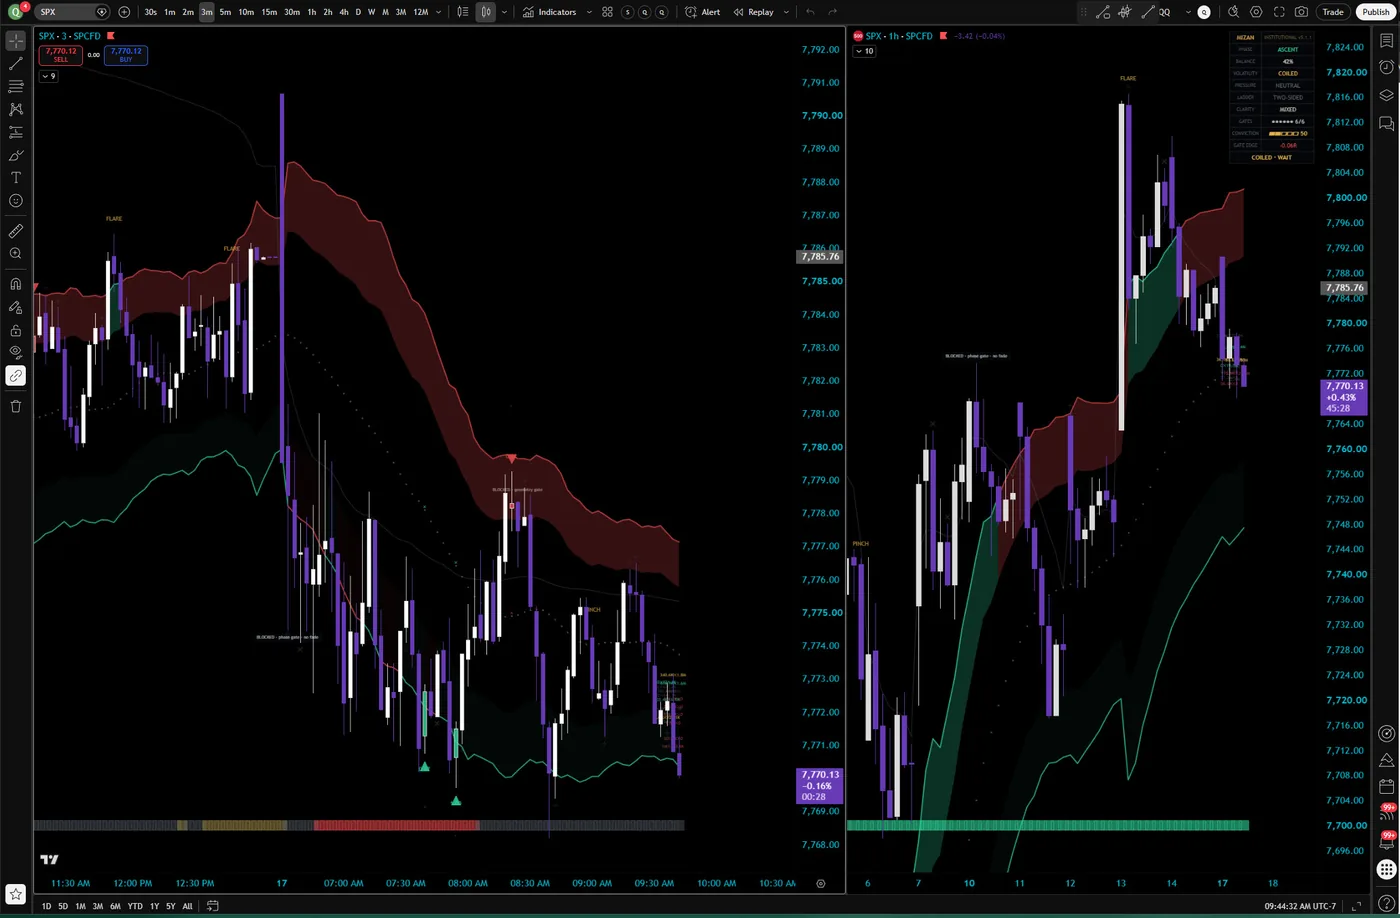
- Pinch, Flare, and phase ribbon Supporting descriptions of compression, expansion, and market state in the historical screenshots. Read status, score, and risk first.
These explanations work without hover. If a small chart label is hard to inspect on your phone, use the written reference here and enlarge the historical example.
04 · Read the panel in its time context
The panel describes the latest bar. Use it for the current chart state. When reviewing a historical reversal, match its printed label and levels to its own time; the current panel does not describe the candle under your cursor. Live-bar values are provisional. “Last confirmed” is a historical reference, not an open-trade status.
- Status A printed signal, waiting state, or first relevant blocking reason. Multiple checks may fail.
- Market and Price The current market state and location within or outside the bands.
- Setup The current reversal candidate and score, or a continuation event. “None” is not a fabricated zero score.
- Reward / risk The candidate’s ratio against its configured minimum. Continuations read “Target only.” Invalid reversal geometry cannot become a signal.
- Order flow Institutional’s available data source. Missing data is not invented evidence.
- Detailed view Adds diagnostics and selected supporting conditions. Those conditions are neither a complete score breakdown nor statistically independent votes.
Common states: Waiting for bar close means unfinished; No setup at band means no current candidate; Blocked: reward / risk means the risk requirement failed. Read the actual status instead of assigning a status from the score alone.
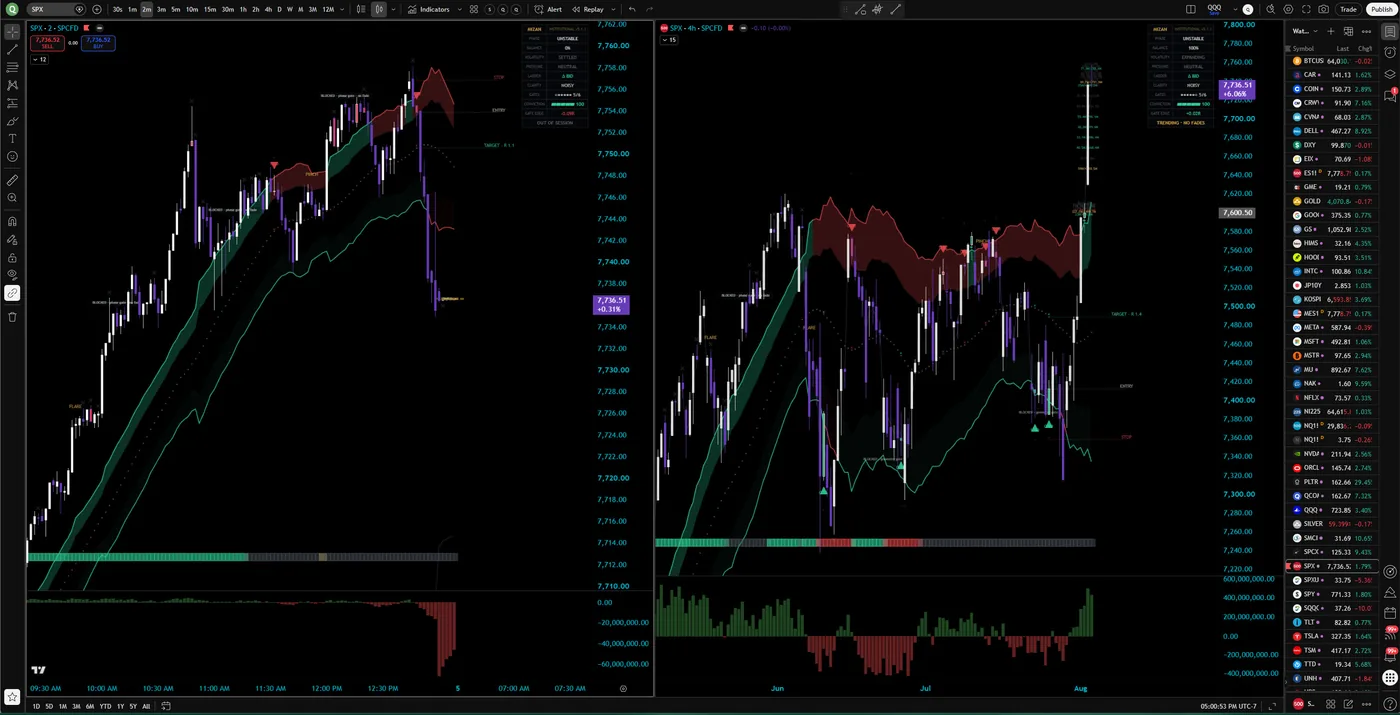
This historical dashboard uses earlier labels. In the reviewed builds, start with Status, Setup, and Reward / risk. A cohort-difference number is descriptive; it does not prove that blocking caused better outcomes.
05 · The ledger, losses included
Enable Track Signal Outcomes and Show Stats Table in settings section 7. The ledger models confirmed reversal signals from the loaded chart history. Continuations are excluded.
For each logged reversal, it uses the signal candle’s close as entry and resolves the stop, target, or expiry under the configured rules. The assumed cost defaults to zero; set an explicit assumption if you want costs deducted.
When blocked tracking is enabled, eligible blocked reversal candidates form a separate hypothetical group. The difference between the groups does not prove what would happen if a check were removed.
Two settings worth knowing
Ambiguous bars use stop-first resolution. If a bar touches both levels, its OHLC data may not establish which came first. Institutional’s optional intrabar resolution can establish target-first only with adequate unambiguous coverage. It is off by default.
Feedback is experimental and off by default. Enabling hourly-outcome feedback allows sufficiently populated tracker history to affect later scores. Do not confuse this optional behavior with independent validation.
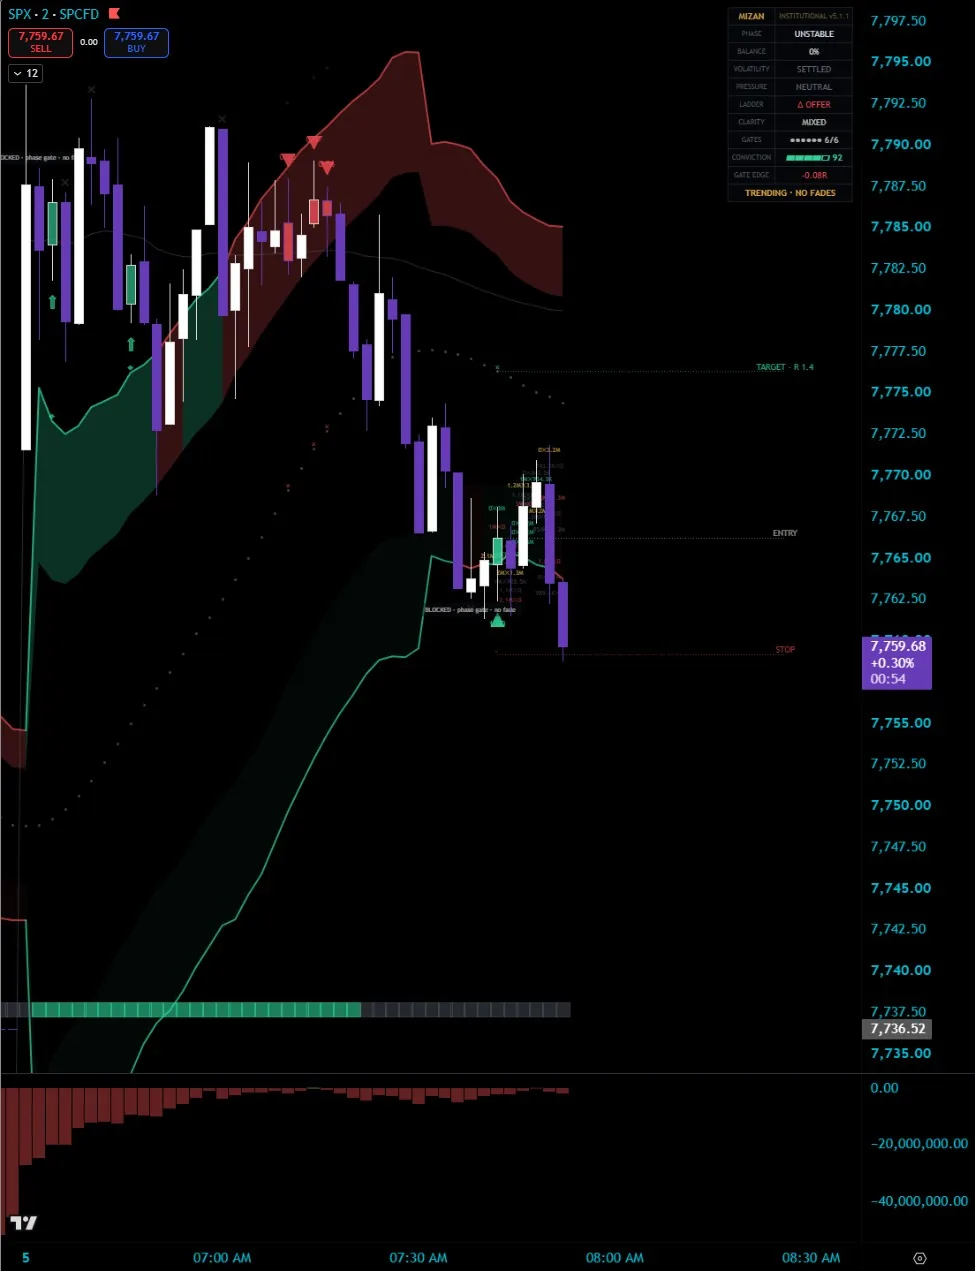
The ledger is not a brokerage statement. It does not model liquidity, partial fills, execution latency, or portfolio position limits. A stopped setup belongs in the record. An immaculate record belongs under suspicion.
Read the accounting rules or watch the complete recordings. Different loaded history, settings, or available data can change a reconstruction.
06 · Settings that change the answer
Identify the current settings before changing them. A saved layout can differ from a fresh instance. Do not change several controls and then guess which one changed the chart.
- Preset Fresh Core defaults to Aggressive; Institutional to Balanced. Conservative uses a 60/100 score floor and 1.5R minimum; Balanced 45/100 and 1.2R; Aggressive 30/100 and 1.0R. Other checks still apply. Custom uses your configured controls.
- Edition calibration The editions can produce different signals. In the reviewed builds, normalization and sample-size shrinkage default off in Core and on in Institutional. These are behavioral settings, not cosmetic switches.
- Bar-close confirmation Keep it enabled for the introductory walkthrough. Disabling it can expose provisional chart signals.
- Session and news windows Check the selected timezone and hours. News times are entered manually; there is no automatic calendar feed.
- Higher timeframe The selected interval must be strictly above the chart interval to contribute. Check the active state in the panel.
- Risk and target mode Change reversal geometry and the reported ratio. Presets override corresponding custom thresholds.
- Manual levels A date range applies only when its limit is enabled. Without a date limit, entered levels apply across loaded history. One range is not a historical daily-level database.
- Ledger and feedback Tracking summarizes hypothetical reversal outcomes. Experimental hourly feedback is a separate opt-in and defaults off.
- Dashboard view Compact or Detailed changes presentation. Use the view that is readable on your device.
Equal score thresholds do not make the editions equally selective. Their score calibration and available evidence differ.
07 · Institutional: the order-flow edition
Institutional adds volume-based evidence and an order-flow display. It follows the same approach to evaluating setups, with different defaults and calibration from Core.
The current script requires TradingView Premium or Ultimate. A lower TradingView plan cannot run it. Fallback handles missing footprint data on an eligible account; it does not bypass that requirement.
TradingView footprint totals, lower-timeframe reconstruction, and structural estimates are distinct sources. The panel identifies the available source. Displayed ladder rows remain reconstructed estimates in the reviewed build.
Volume is classified using price movement, not guaranteed raw exchange aggressor ticks. This does not identify who placed an order.
Read the data-source explanation. Check plan requirements before starting a trial.
08 · Alerts and updates
Start with ordinary notifications. Choose the relevant alert condition in TradingView and use once-per-bar-close behavior for a close-confirmed evaluation. Chart confirmation is controlled by Confirm Signals on Bar Close.
For structured webhooks, enable JSON alert() Payloads on Bar Close, then create an alert on Any alert() function call. Dynamic JSON alerts are close-only. A webhook requires a separately configured destination; MIZAN does not place broker orders itself.
Payload fields depend on the event. Reversal alerts carry their score and risk information. Continuation alerts do not carry reversal scores or stops. Preserve the supplied payload format if you use an integration.
TradingView alerts retain a snapshot of their script and settings. Recreate relevant alerts after an update or settings change. An updated chart does not automatically update an existing alert.
09 · Questions that matter
Can a high score be blocked?
Yes. A score cannot override a failed risk, session, market, or confirmation requirement. Read Status first.
Does a confirmed signal guarantee an outcome?
No. Confirmation describes when the signal printed. A qualified setup can still lose.
Can historical readings change?
Yes. Loaded history, changed settings, and available data can change historical calculations. Live-bar readings are provisional. Bar-close confirmation does not freeze every future reload.
Why can two charts differ?
Compare the edition, version, preset, settings, symbol, timeframe, loaded history, and data source. Experimental feedback can add another history dependency when enabled.
Which charts should I start with?
Start with regular candles on a market and timeframe you already understand. MIZAN is designed for stocks, indices, futures, forex and crypto, including intraday and longer timeframes.
Check data availability, session hours and the active settings before comparing readings. A configuration used on an intraday index chart is not automatically the right fit for a daily stock or a round-the-clock crypto market. Read the market and data notes.
Does MIZAN trade for me or stop me trading?
Neither. It analyzes the chart. You control execution, position size, and account risk.
Where do I manage billing?
In Whop, using the account that holds the subscription. Review the selected offer’s renewal terms and manage cancellation there.
10 · If something looks wrong
- Different ledger totals Compare loaded history, settings, and data availability. The table rebuilds; it is not a permanent broker record.
- No signal Read Status. Waiting, no candidate, disabled signals, and a blocked setup are different states.
- Institutional data unavailable Check the platform requirement and coverage. The engine does not invent missing order-flow evidence.
- Alert still looks old Recreate it after updating the script or relevant settings.
- Session or manual levels look wrong Check timezone, session hours, and any enabled date range. The engine reads the settings it has.
Send the details below and a screenshot to qasim@mizanquant.com. Keep passwords and brokerage credentials out of it.
Edition and version:
Symbol and exchange:
Timeframe:
Status shown:
Relevant setting:
What I expected:
What happened:
Screenshot attached:
Open an email with this checklist →
It grades the setup. The call stays yours.
Download the PDF guide Start the 7-day free trial
7-day free trial · Cancel anytime · Secure checkout on Whop