Blended Math Genius Average
AsksWhat regime is the tape in right now?
A blended price average with bands that widen or narrow as volatility changes.
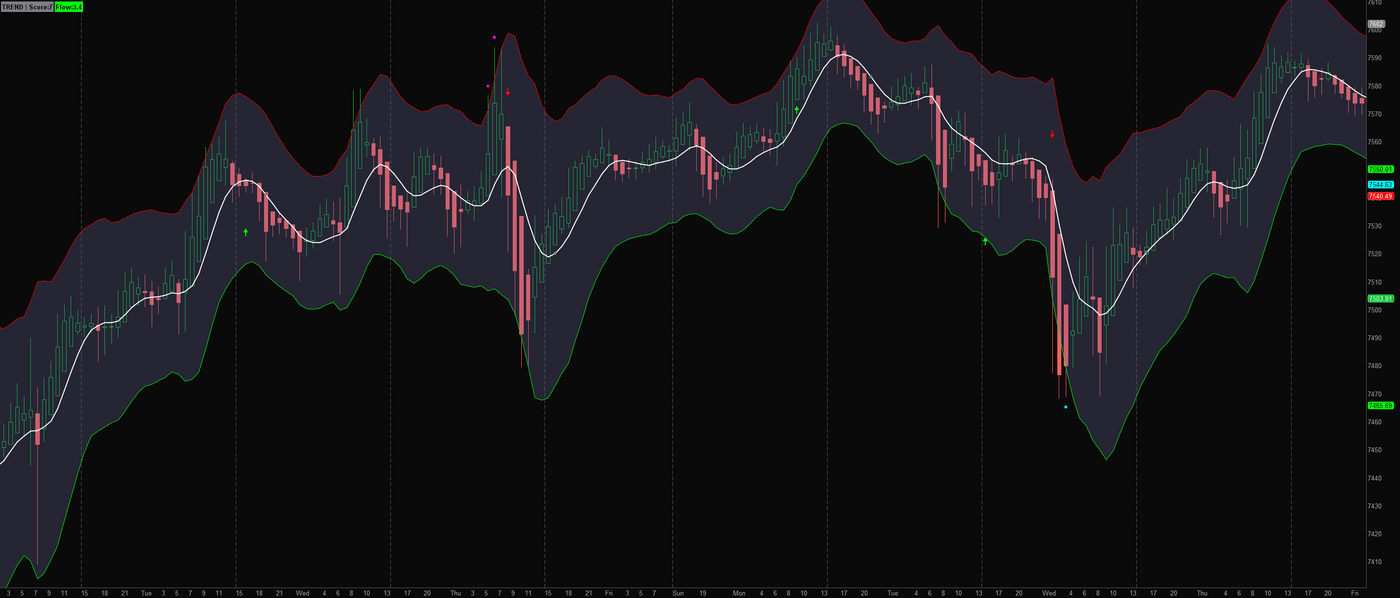
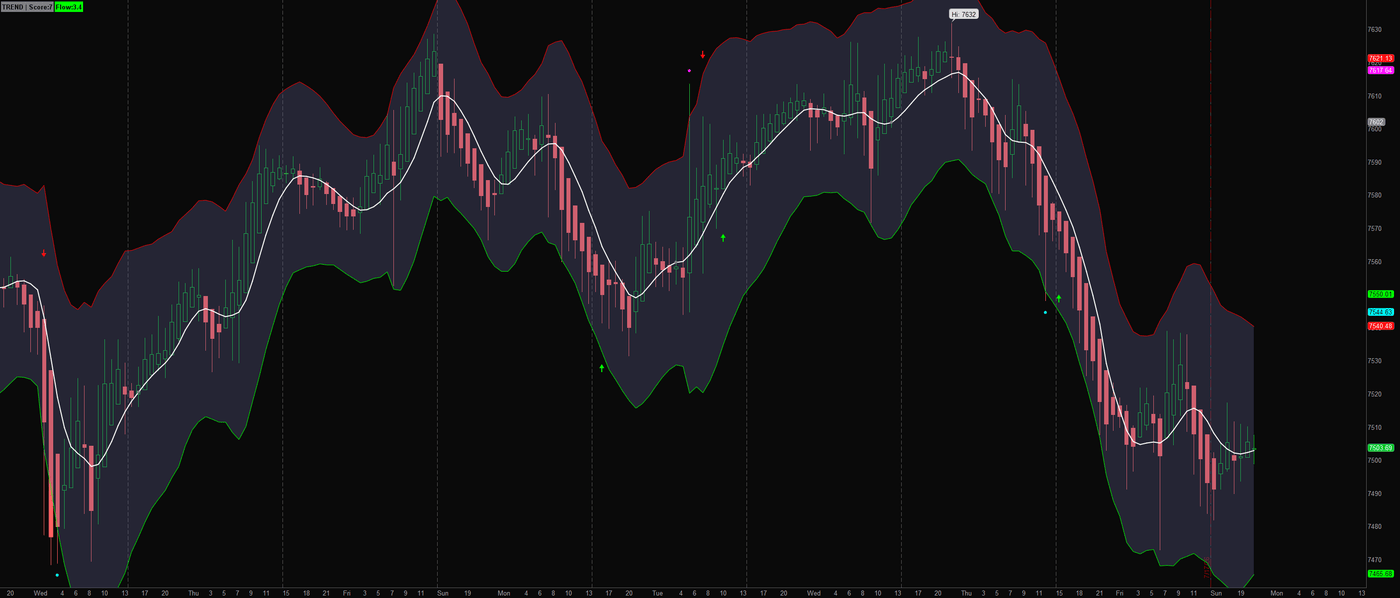
These examples show the full build. The free download is Lite; values and markers can differ.
Download the Lite thinkScript →
What it measures and how
Yes, that is really the name. The free Lite build blends two Hull averages with an efficiency-based smoothing component, then wraps that midline in an ATR envelope. Regime, flow, and touch markers make the result a compact view of changing conditions on the price chart.
Get started
- Download the Lite thinkScript and install the full file through Charts → Studies → Edit Studies → Create in thinkorswim desktop.
- Begin with the white midline and red/green envelope. Compare the band's expansion and contraction with the nearby candles.
- Read the regime label before interpreting a transition arrow. TREND, RANGE, and VOLATILE describe the study's conditions rather than an instruction to trade.
- Inspect cyan and magenta touch dots together with the Flow label. Use the display toggles to keep the midline, bands, labels, and markers readable on your chart.
How to read it
A band that breathesThe envelope uses ATR around the blended midline. Its multiplier adjusts with current ATR relative to its recent baseline, so both the measured volatility and the multiplier influence its width.
Regime is not directionA green upward arrow marks a transition into the TREND regime, including a qualifying downtrend. A red downward arrow marks a transition into VOLATILE conditions. A gray dot marks a transition into RANGE.
Touches with contextA cyan dot combines a lower-band touch with positive flow; a magenta dot combines an upper-band touch with negative flow. Flow is derived from volume-weighted close-to-close direction. The score combines that flow with band position and directional trend conditions.
Know the limits
The downloadable file is the Lite build. The supplied example screenshots were captured with the full build, whose internals differ; exact values and markers can differ.
The score is a rule-based composite, not a calibrated win probability. Flow is a price-and-volume proxy rather than measured bid/ask order flow.
Bands, regime transitions, and touch markers use the active bar and can change while it forms. A band touch does not establish a reversal.
Open source, no email wall. Read the code, test it on your own chart, and keep it. Explore all 20 free tools.
Keep the tool.
Add a second read.
Blended Math Genius Average combines a price average with volatility-sensitive bands. Keep that focused view.
The paid MIZAN engine runs on TradingView. It adds the market read, the score and explained blocked setups for the candidates it detects. Reversal setups that pass get entry, stop and target references.
MIZAN is a separate engine, not a bundle of these free tools. Compare its read with your own method.
See passed setups, blocked setups and losses →
7-day trial starts at checkout · From $79.99/month afterward · Cancel through Whop · Manual access within six hours after checkout and receipt of your correct TradingView username