Cross-Examination
AsksWhich average is winning the argument?
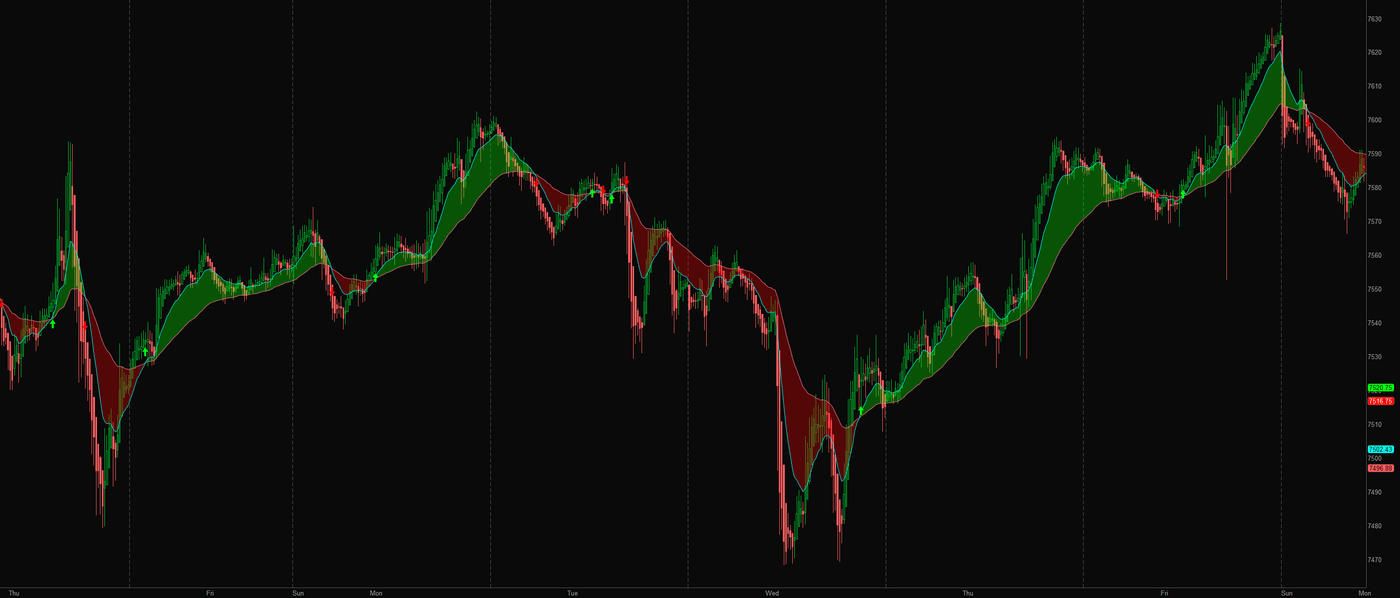
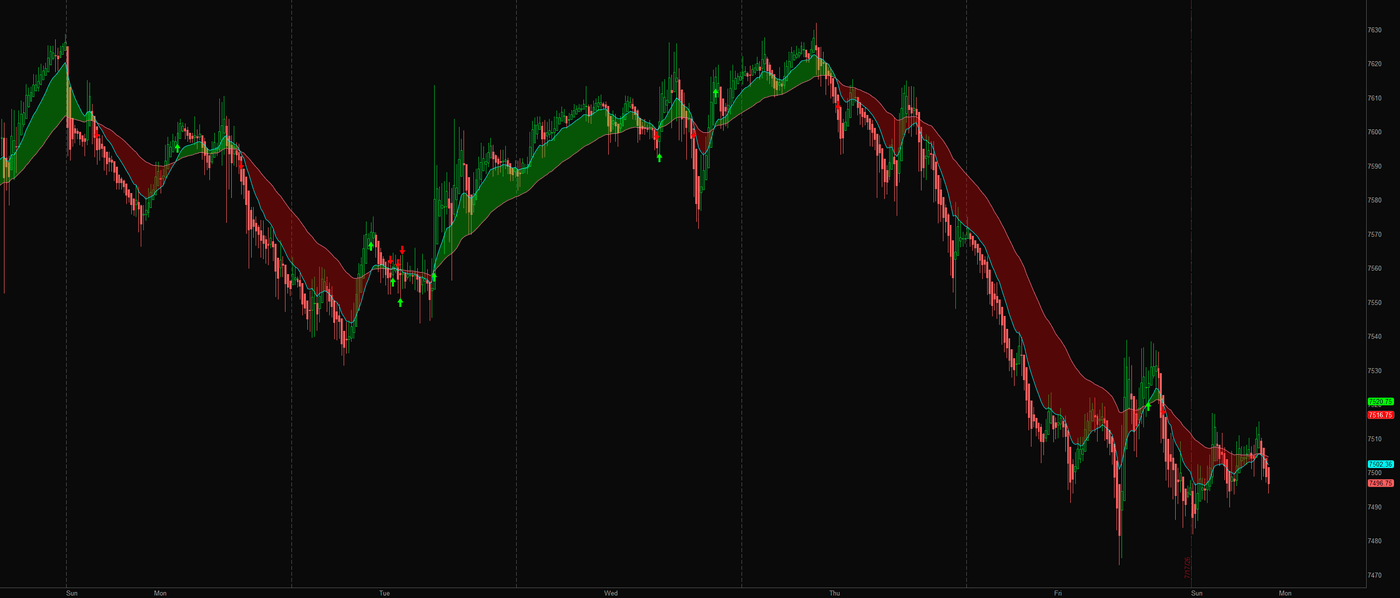
Shows which moving average is above the other and marks where they cross.
What it measures and how
Cross-Examination puts a fast and slow moving average on the price chart, colors the space between them, and marks their crossings. The result is a simple, readable view of direction and separation, with an explicit choice about when crossover arrows become visible.
Get started
- Install the complete downloaded file as a new study through Charts → Studies → Edit Studies → Create in thinkorswim desktop.
- Identify the cyan fast line and light-gray slow line. Read the cloud color and the status label's spread in ticks.
- Keep confirmOnClose enabled if you want arrows to appear only after a subsequent bar exists. Compare that timing with the candle where the cross occurred.
- Inspect both trending and sideways history before changing the average lengths or averaging method.
How to read it
Who is on topA green cloud means the fast average is above the slow average; red means it is below. The cloud shows the relationship continuously, while an arrow marks a crossing event.
What separation addsThe status label reports the absolute gap between the averages in ticks. It describes their current separation; it does not estimate the probability that the move will continue.
How confirmation worksWith confirmOnClose enabled, the script checks that the next bar exists before showing the cross arrow on the preceding candle. Disabling it allows the active bar's cross to appear immediately.
Know the limits
Moving averages lag price by design. Sideways conditions can produce repeated crossings and quick reversals.
The averages and cloud remain live on the active candle even when completed-bar arrow confirmation is enabled.
Historical arrows show where a crossing occurred. In confirmed mode, the arrow was only available once the following bar existed.
That following-bar check also feeds the alert and scan conditions. Do not treat a historical arrow as evidence that a live alert or scan fired. Test those separately before relying on them.
Open source, no email wall. Read the code, test it on your own chart, and keep it. Explore all 20 free tools.
Keep the tool.
Add a second read.
Cross-Examination shows the relationship between two moving averages. Keep that focused view.
The paid MIZAN engine runs on TradingView. It adds the market read, the score and explained blocked setups for the candidates it detects. Reversal setups that pass get entry, stop and target references.
MIZAN is a separate engine, not a bundle of these free tools. Compare its read with your own method.
See passed setups, blocked setups and losses →
7-day trial starts at checkout · From $79.99/month afterward · Cancel through Whop · Manual access within six hours after checkout and receipt of your correct TradingView username