Level Survival Tracker
AsksWhen price reaches yesterday’s high, what usually happens next?
Counts how often price tests and breaks six familiar levels, with sample sizes.
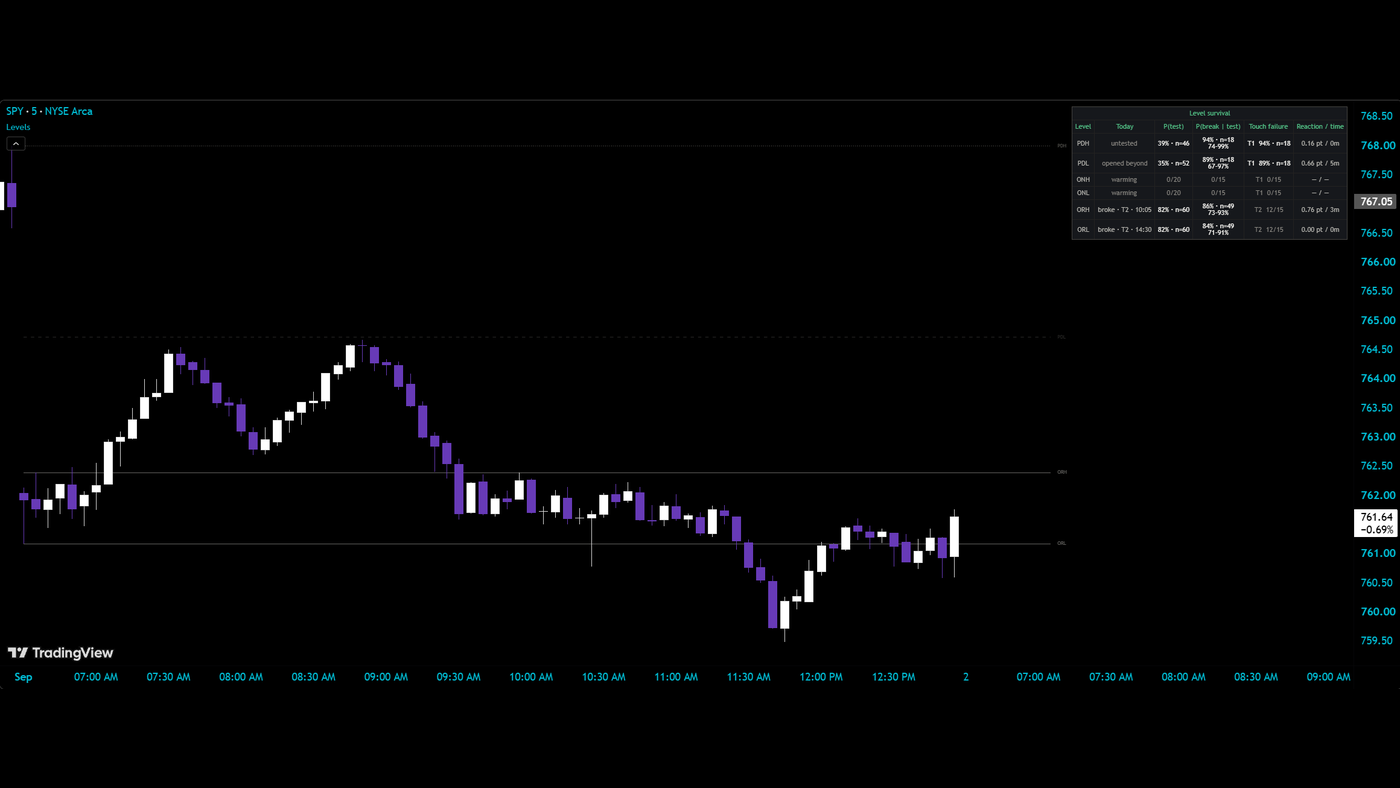
What it measures and how
A line on the chart tells you where a level is. Level Survival Tracker adds a record of what has happened there. It follows prior-day, overnight and opening-range highs and lows, measuring how often each level is tested, how often a test becomes a break, first-touch failure, median reaction and time-to-break.Today's status sits beside that history so you can distinguish what has already happened from the behavior of previous observations.
Get started
- Open the TradingView script using the link above and add it to your intraday chart.
- Identify the level family you are studying: prior-day, overnight or opening range. Each family has a high and a low.
- Review the tolerance choice—ticks, points or ATR—and whether gap or volatility-regime conditioning is enabled. Those choices affect which observations are being compared.
- Read today's status first, then compare the historical test rate with the break-given-test rate and its confidence interval.
- Add first-touch failure, median reaction and time-to-break to the picture. These describe different aspects of the level's behavior; a single percentage cannot replace the full row.
How to read it
Test rate and break rate answer different questionsThe test rate describes how often price reaches a level. The break-given-test rate describes what happened among observations where that level was tested. Do not read the second number as the unconditional chance that the level will break today.
Today's status is an observationThe row labels the level as untested, tested, broke or opened beyond. Read that status before applying the historical figures: a level that price has already opened beyond is in a different current state from one that remains untouched.
Tolerance defines the comparisonThe tool supports tolerance in ticks, points or ATR. Keep that choice in view when comparing results; changing how close price must come to a level can change what qualifies as a test and the resulting history.
Reaction and timing add contextFirst-touch failure, median reaction and time-to-break describe more than whether a line eventually broke. Use them to examine how past encounters developed, while keeping the confidence interval and the selected gap or volatility conditions in view.
Know the limits
Historical test and break frequencies are sample estimates, not promises about the next encounter. The confidence interval belongs with the percentage.
Optional gap and volatility-regime conditioning changes the comparison group and can leave fewer observations. A more specific group is not automatically a more reliable one.
Updates use confirmed bars. An intrabar touch or move may not yet appear in the settled reading.
Open source, no email wall. Read the code, test it on your own chart, and keep it. Explore all 20 free tools.
Keep the tool.
Add a second read.
Level Survival Tracker records tests and breaks of familiar levels. Keep that focused view.
The paid MIZAN engine runs on TradingView. It adds the market read, the score and explained blocked setups for the candidates it detects. Reversal setups that pass get entry, stop and target references.
MIZAN is a separate engine, not a bundle of these free tools. Compare its read with your own method.
See passed setups, blocked setups and losses →
7-day trial starts at checkout · From $79.99/month afterward · Cancel through Whop · Manual access within six hours after checkout and receipt of your correct TradingView username