Composite Liquidity Flow
AsksIs the index basket leaning together—or arguing with itself?
Estimates buying and selling pressure across five index instruments and shows whether they agree.
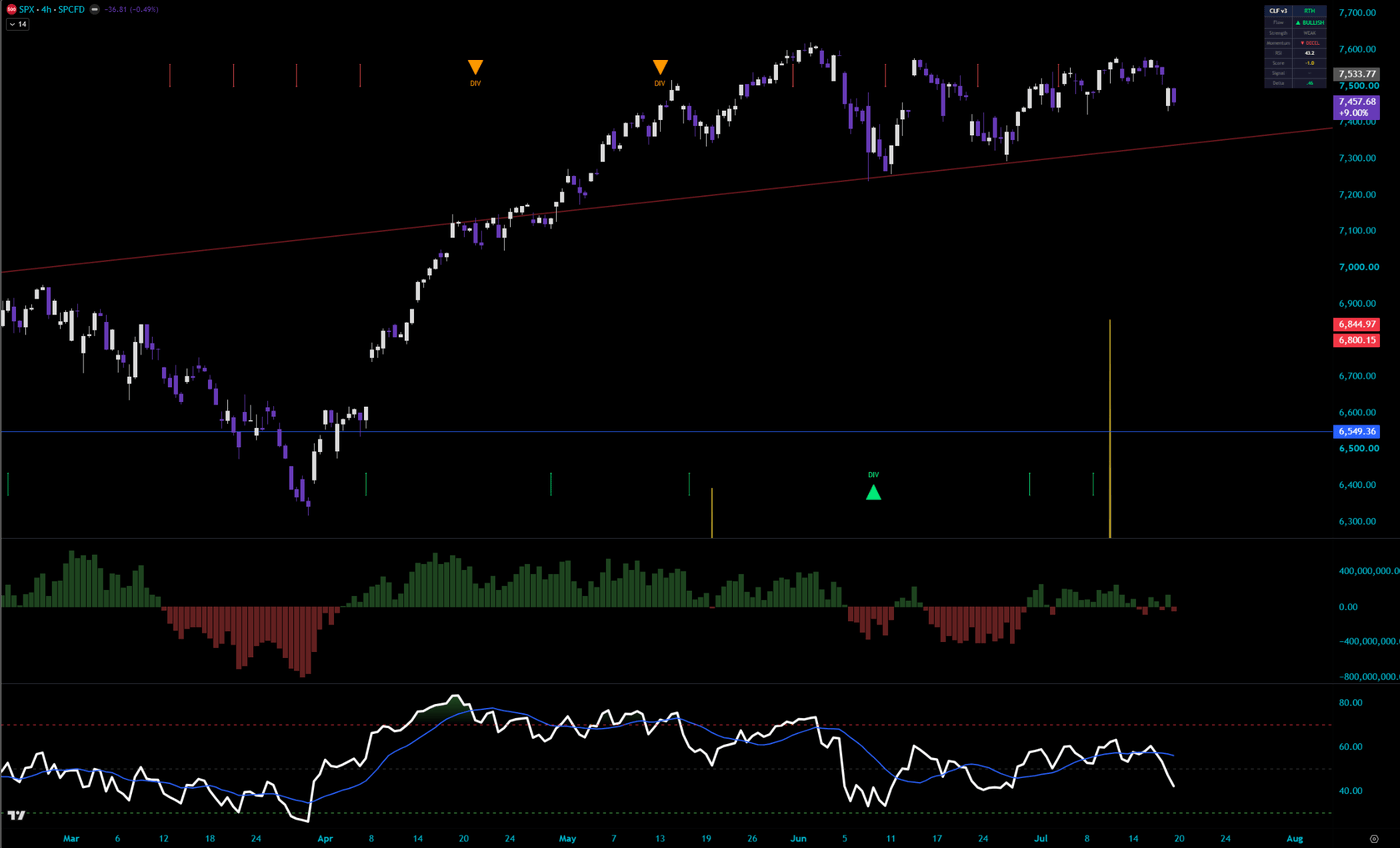
What it measures and how
One histogram estimates buying and selling pressure across a five-instrument US index basket: index futures, their ETFs, and an inverse hedge ETF whose estimated flow is inverted. Use it to compare agreement across that basket.Every leg is scaled by its own relative volume before it is combined, so futures contracts and ETF shares are not mixed as if they shared a unit, and legs with no data drop out of both the numerator and the denominator.The net is weighted, smoothed, and z-scored into a single pane with an RSI filter on top. Agreement markers print only when flow, its slope, breadth across the legs, and the filter all point the same way; divergence marks compare confirmed price pivots, not rolling ranges.All of it is estimated from OHLCV: a careful proxy, not tick data. It reads the index complex, not your single stock.
Plain EnglishIf the futures, index ETFs, and inverse hedge lean together, the basket is telling a more consistent story. Five witnesses; still not the whole market.
Get started
- Open the free TradingView script above and add it to an intraday chart. The default basket provides context for the US index complex.
- Check Coverage first: it shows how many basket legs have usable data. Then compare the histogram direction with breadth across those legs.
- Read agreement markers separately from the histogram. They require flow, slope, breadth and the filter to agree; confirmed-pivot divergences arrive later than the pivot itself.
Inputs and settings
Composite assetsFive symbol slots: two futures, two funds, and an inverse hedge whose flow is inverted. Minimum active legs for signals (default 4) blocks markers and alerts when too much of the composite is missing or outside its session.
WeightingPer-asset weights, funds weighted up by default because fund flow reads differently from futures. Only legs with a valid current bar and nonzero weight enter the denominator.
Smoothing and normalizationSmoothing length 25, z-score normalization over the last 50 in-session values, a 30-bar per-asset relative-volume baseline, and a 5x RVOL cap so one bad print cannot hijack the composite.
FilterAn RSI computed inside the filter symbol’s own context (ES by default), 14 length, bands at 70 and 30. Require filter agreement for markers is on; divergence confirmation uses fixed levels of 60 and 40 at the price pivot.
Session filterOn by default: the same regular-hours gate is applied to every leg so the composite universe does not change between overnight futures-only data and the cash open. Pre-market histogram suppression is a display choice only.
MarkersAgreement markers need flow, its slope, at least 60% directional breadth across active weight, and the filter to agree, with a 10-bar cooldown. Divergences compare confirmed price pivots, 3 bars each side by default.
When it fails
It is a proxyCandle-location pressure estimates participation from OHLCV. It is not bid/ask delta, and relative-volume scaling makes legs comparable without creating any causal link between them.
Cross-symbol feeds differSessions, delays, volume rules and entitlements differ across the five legs. A leg with no bar on the chart’s timestamp drops out for that bar, and the Coverage row tells you how many legs are live.
It reads the index complexThe default basket is the US index complex. On a single stock, or a market unrelated to the basket, the composite says nothing about your chart.
Intraday onlyThe session gate and per-leg baselines are defined against the regular New York session. It refuses to run on daily or higher.
Open source, no email wall, no upsell gate. Read the code, test it on your own tape, keep it. Every other tool on the workbench is the same deal: see all 20.
Keep the tool.
Add a second read.
Composite Liquidity Flow shows agreement across an index basket. Keep that focused view.
The paid MIZAN engine runs on TradingView. It adds the market read, the score and explained blocked setups for the candidates it detects. Reversal setups that pass get entry, stop and target references.
MIZAN is a separate engine, not a bundle of these free tools. Compare its read with your own method.
See passed setups, blocked setups and losses →
Test it on your tape — 7 days free
7-day trial starts at checkout · From $79.99/month afterward · Cancel through Whop · Manual access within six hours after checkout and receipt of your correct TradingView username