Fulcrum
AsksIs tech rich or cheap against the broad market right now?
Shows how far the relationship between two markets sits from its volume-weighted average.
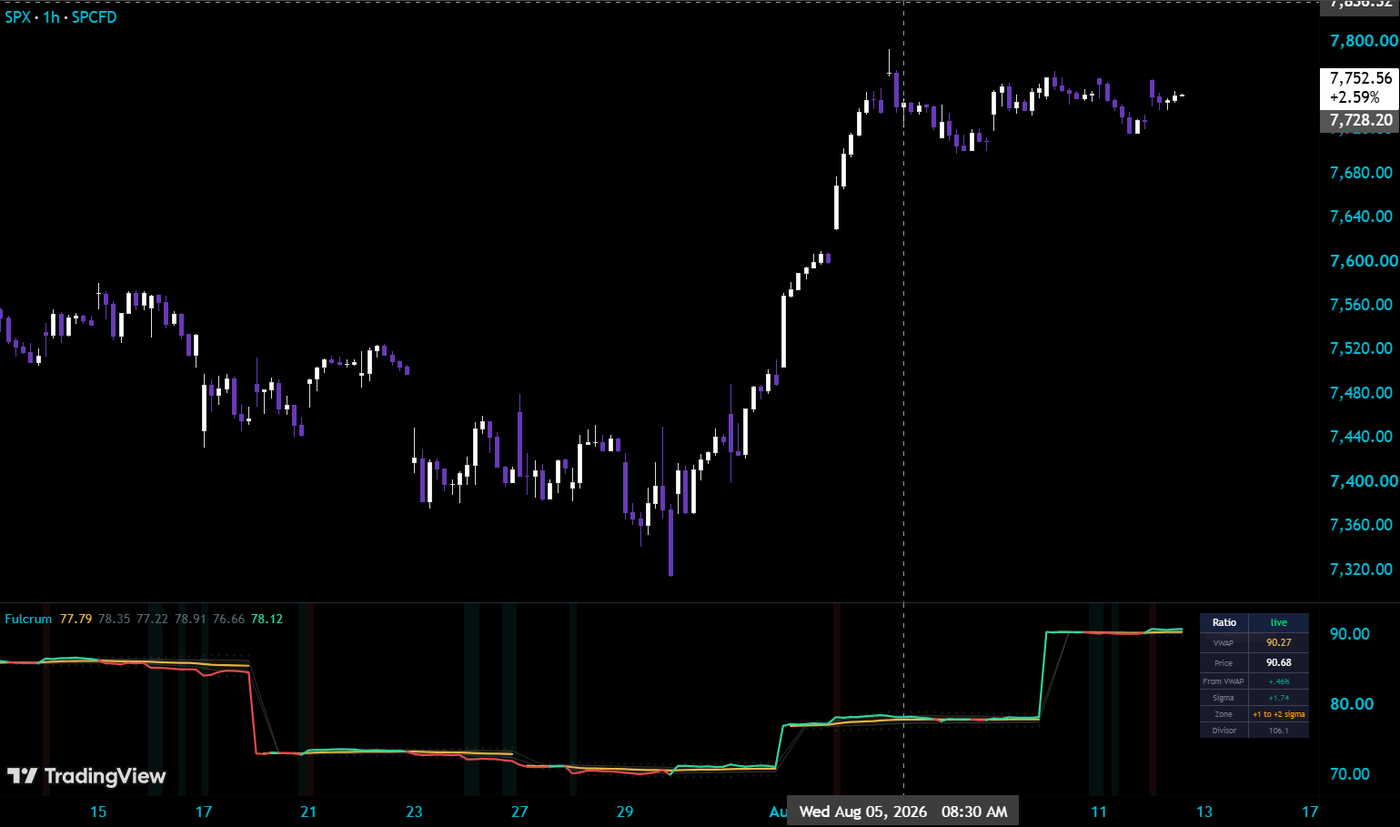
What it measures and how
A session VWAP drawn on the relationship between two markets instead of one. It rebuilds the NQ/ES ratio bar by bar — 2500·NQ/ES, optionally normalized by the prior session’s VXN×US10Y — weights it by the geometric mean of both legs’ volume, and anchors a session, weekly, or monthly VWAP with ±1σ and ±2σ bands on the result.Zone readout, price labels, and cross alerts included. The risk divisor uses confirmed prior-day closes and stays fixed through the selected anchor. The ratio itself can still change while a bar forms. The default NQ/ES relationship appears in its own pane with its own scale; the selected feeds and anchor determine the comparison.
Plain EnglishOne line shows whether the relationship is above or below its volume-weighted mean for the selected anchor. The bands show how far it has stretched from that mean; they do not establish that it will return.
Get started
- Open the free TradingView script above and check that the selected numerator and denominator both provide price and volume data. The default pair is NQ and ES.
- Check the anchor and any warming-up or missing-data status before reading the bands. Auto can select a different anchor when you change chart timeframe.
- Compare the ratio with its weighted mean and zone readout. A band crossing describes relative stretch within that anchor; it does not establish the next move in either market.
Inputs and settings
Ratio componentsNumerator NQ, denominator ES, multiplier 2500 by default. The sample is the synchronous close ratio; the legacy synthetic HLC sample is available but combines extremes that did not occur at the same instant.
Risk adjustmentDivide by the prior confirmed daily closes of VXN and US10Y. The divisor is frozen for the whole anchor period. If a risk feed is missing, you choose: use the unadjusted ratio, or hide output until the next anchor. No placeholder value is ever substituted.
AnchorAuto picks Session through 20-minute charts, Week through 4-hour, Month above. The reset is read in the numerator’s exchange context so the chart symbol does not decide when the ratio restarts.
BandsHide bands for the first N observations (3) and require a minimum effective sample size (3). Effective N is sum(w)² / sum(w²): it drops when a few high-volume bars dominate the weighting. A minimum dispersion in basis points prevents tiny post-reset spreads from producing enormous sigma readings.
When it fails
Both legs need volumeThe weight is the geometric mean of the two legs’ volume. A leg without volume, such as a cash index, produces no observations at all.
Missing bars are skipped, not filledSecurity requests use gaps on and lookahead off. A missing leg bar is skipped; stale carried-forward values never enter the ledger. On mismatched sessions the sample can be thinner than the chart suggests.
Early in the anchorRight after a reset the mean is a handful of observations. The bands stay hidden until the observation and effective-N minimums are met; the dashboard reads warming up until then.
It is a relationship, not a signalThe ratio describes how two markets have moved together in this anchor. Crossing a band is a statement about dispersion, not a forecast of either leg.
Open source, no email wall, no upsell gate. Read the code, test it on your own tape, keep it. Every other tool on the workbench is the same deal: see all 20.
Keep the tool.
Add a second read.
Fulcrum compares the relationship between two markets with its volume-weighted average. Keep that focused view.
The paid MIZAN engine runs on TradingView. It adds the market read, the score and explained blocked setups for the candidates it detects. Reversal setups that pass get entry, stop and target references.
MIZAN is a separate engine, not a bundle of these free tools. Compare its read with your own method.
See passed setups, blocked setups and losses →
Test it on your tape — 7 days free
7-day trial starts at checkout · From $79.99/month afterward · Cancel through Whop · Manual access within six hours after checkout and receipt of your correct TradingView username