Streak Statistics
AsksAfter four up bars in a row, does the fifth care?
Checks what historically followed consecutive up or down closes, including uncertainty from small samples.
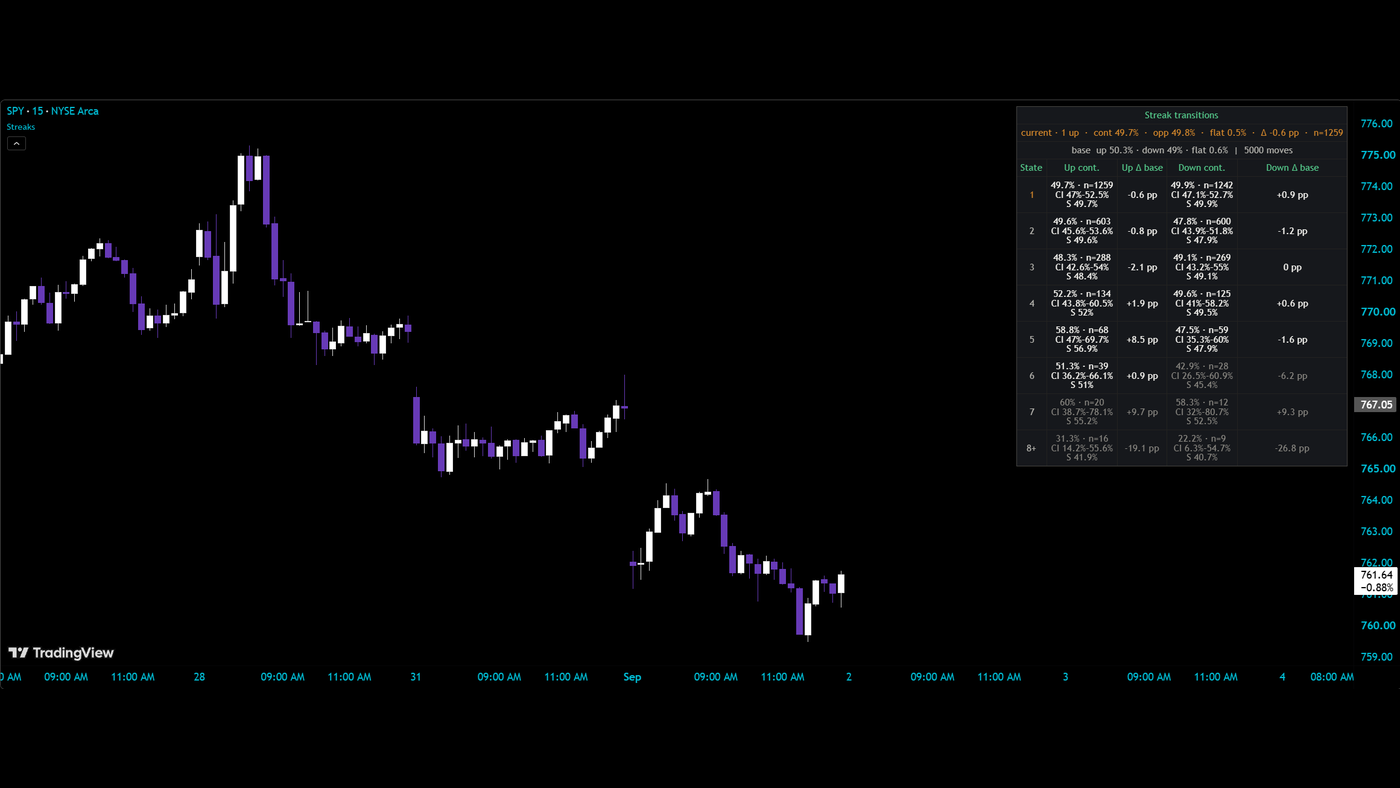
What it measures and how
After several consecutive up or down closes, it is easy to assume the next bar must continue or reverse. Streak Statistics checks the chart's history instead. For each streak length, it shows the historical continuation and reversal shares, confidence intervals, a stabilized estimate for thin samples and the difference from the base rate.Rows with too few observations are muted, keeping a dramatic percentage from outranking the evidence behind it.
Get started
- Open the TradingView script using the link above and add it to the symbol and timeframe you want to study.
- Find the row for the direction and length of the streak you are inspecting. The tool counts consecutive up or down closes.
- Check whether that row meets the minimum sample before reading its continuation or reversal percentage. Muted rows indicate insufficient history under that rule.
- Compare the estimate and confidence interval with the base rate. Use lift to see whether the streak's history differs meaningfully from that baseline.
- Review the session or calendar boundary choice when comparing streaks. Censoring at a boundary prevents a run from being carried across that boundary as though it were uninterrupted.
How to read it
A streak has a comparison groupEach row groups historical observations by streak direction and length. A continuation percentage describes what followed those observations on this chart; it does not make the next bar owe you the same result.
The base rate is the benchmarkA percentage can look impressive until it is compared with the baseline. Lift shows the departure from the base rate, helping distinguish an unusual streak relationship from behavior that was already common in the underlying sample.
Thin rows deserve less weightThe tool supplies a stabilized estimate for thin rows and mutes rows below the minimum sample. Read those cues together with the confidence interval. Stabilization does not create additional observations or turn sparse history into certainty.
Emphasis can point either wayA material departure from the base rate is emphasized when its interval is separated from the baseline, whether continuation is higher or lower. An unremarkable row is useful too: the observed streak may be telling you little beyond the base rate.
Know the limits
Long streaks can leave thin samples. An extreme percentage from few observations is not strong evidence by itself.
The results describe the selected chart and boundary rules. Changing symbol, timeframe or censoring changes the observations behind the table.
Continuation and reversal shares do not measure trade profitability. They do not account for how far a trade moves, its execution costs or your exit rules.
Open source, no email wall. Read the code, test it on your own chart, and keep it. Explore all 20 free tools.
Keep the tool.
Add a second read.
Streak Statistics puts consecutive up and down closes in historical context. Keep that focused view.
The paid MIZAN engine runs on TradingView. It adds the market read, the score and explained blocked setups for the candidates it detects. Reversal setups that pass get entry, stop and target references.
MIZAN is a separate engine, not a bundle of these free tools. Compare its read with your own method.
See passed setups, blocked setups and losses →
7-day trial starts at checkout · From $79.99/month afterward · Cancel through Whop · Manual access within six hours after checkout and receipt of your correct TradingView username