Realized Volatility Term Structure
AsksIs the short end of volatility hot or cold right now?
Compares recent price movement with longer history to show whether volatility has changed.
What it measures and how
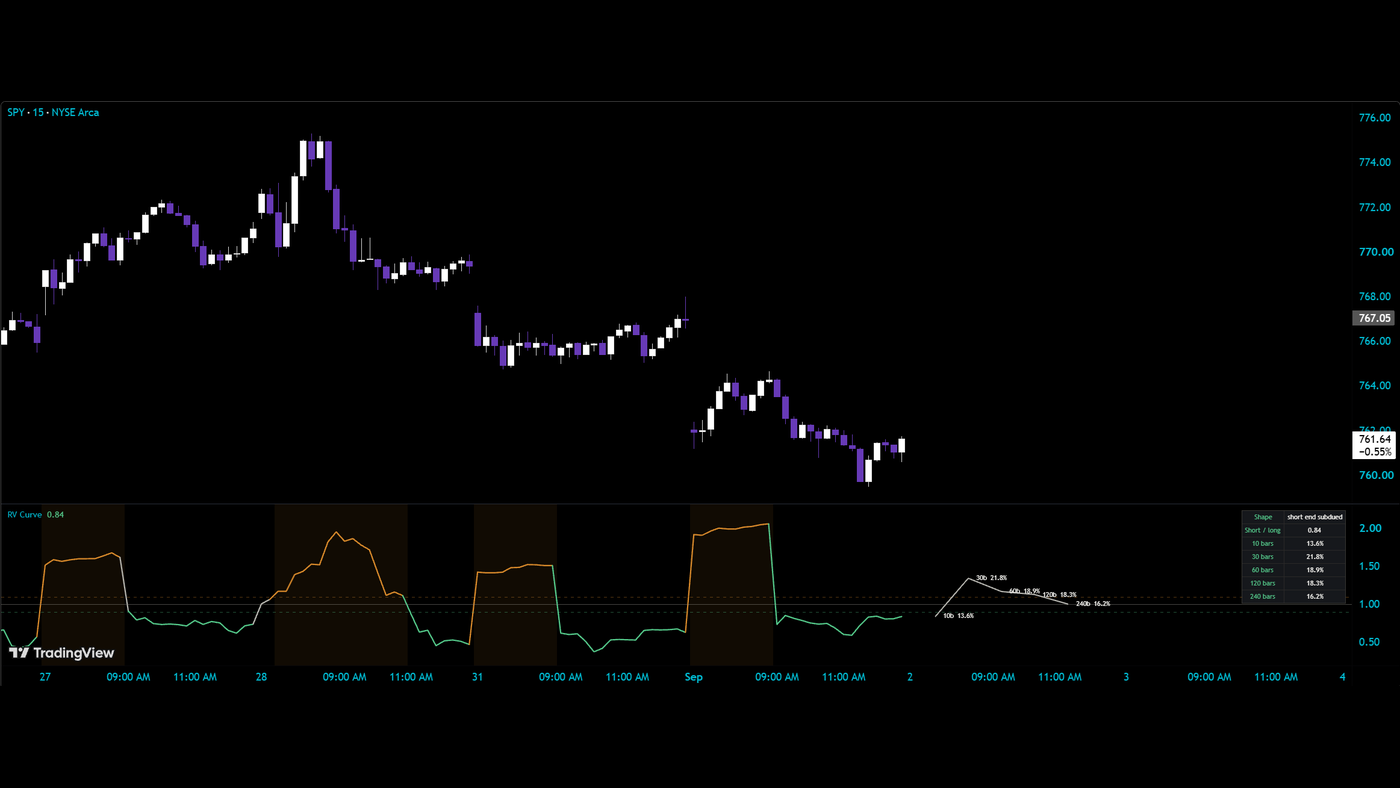
One volatility number can hide a recent change in pace. Realized Volatility Term Structure measures five windows—10, 30, 60, 120 and 240 bars—and compares their annualized readings. The curve shows whether recent volatility is elevated, similar or subdued relative to the longer history. The lower pane tracks the short-to-long ratio through time, while the table shows all five windows together.
Get started
- Open the TradingView script using the link above and add it to the chart you want to inspect.
- Start with the table to compare all five windows. These are bar counts, so their elapsed time depends on your chart timeframe.
- Read the curve from the short window to the long window. Identify whether the short end is elevated, roughly flat or subdued relative to the long end.
- Use the ratio pane to see when that relationship changed and whether the current shape is part of a sustained stretch or a recent shift.
- Review the curve again after changing timeframes. A 10-bar window on a one-minute chart describes a different span from 10 bars on a 15-minute chart.
How to read it
Short end elevatedThe recent bars have been more volatile than the longer baseline. This describes an increase in realized movement; it does not tell you whether that movement will continue or which direction price will take.
A flatter curveSimilar readings across the windows mean recent realized volatility is closer to its longer-window context. Flat describes the relationship between windows, not an absence of price movement.
Short end subduedThe recent bars have been calmer than the longer baseline. The long window may still contain earlier turbulence even after the most recent bars have quieted down.
The ratio adds historyThe curve is a snapshot; the lower pane shows how the short-to-long relationship developed. A ratio above one means the short reading exceeds the long reading, while a ratio below one means it is lower, when both underlying readings are available and the ratio is defined.
Know the limits
This measures realized volatility from past bars. It is neither an implied-volatility curve from options prices nor a forecast of future movement.
Annualization does not make the windows interchangeable. Changing the chart timeframe changes the elapsed history covered by every bar-count window.
The ratio describes a relationship between two readings. Check the table for their levels before treating the ratio alone as a measure of how active the market is.
Open source, no email wall. Read the code, test it on your own chart, and keep it. Explore all 20 free tools.
Keep the tool.
Add a second read.
Realized Volatility Term Structure compares price movement over different windows. Keep that focused view.
The paid MIZAN engine runs on TradingView. It adds the market read, the score and explained blocked setups for the candidates it detects. Reversal setups that pass get entry, stop and target references.
MIZAN is a separate engine, not a bundle of these free tools. Compare its read with your own method.
See passed setups, blocked setups and losses →
7-day trial starts at checkout · From $79.99/month afterward · Cancel through Whop · Manual access within six hours after checkout and receipt of your correct TradingView username