Redirect
AsksIs that RSI signal worth a follow-up question?
Separates an initial RSI move from a later pullback or bounce that holds.
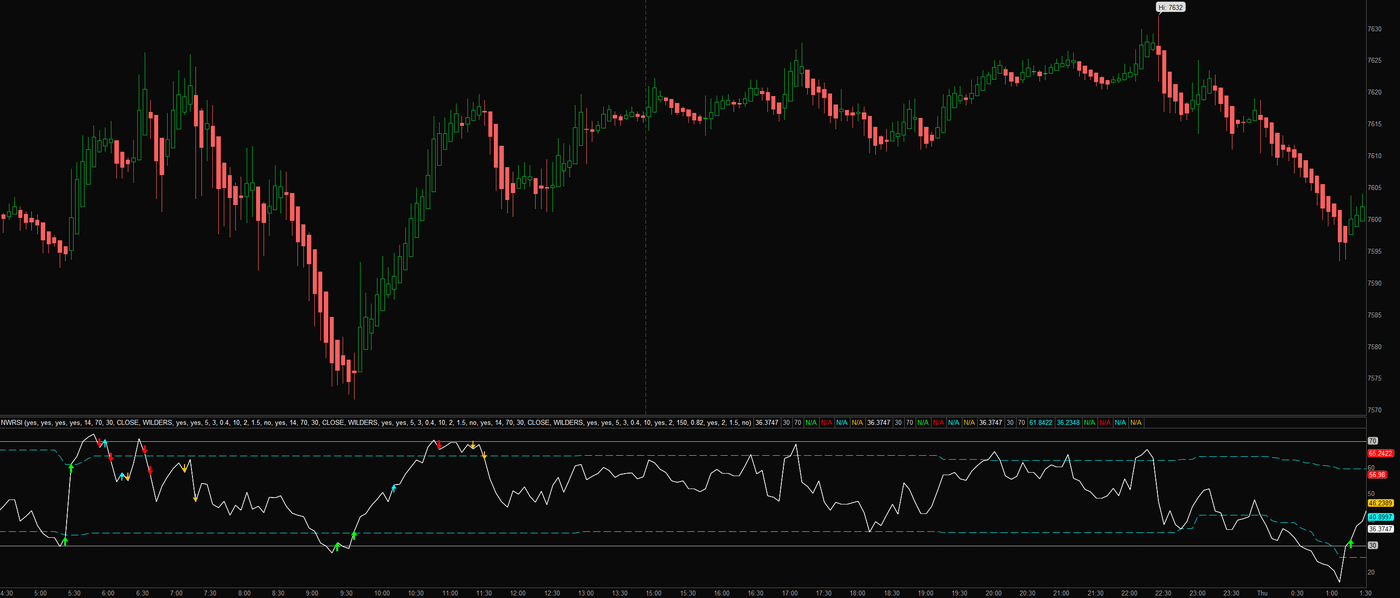
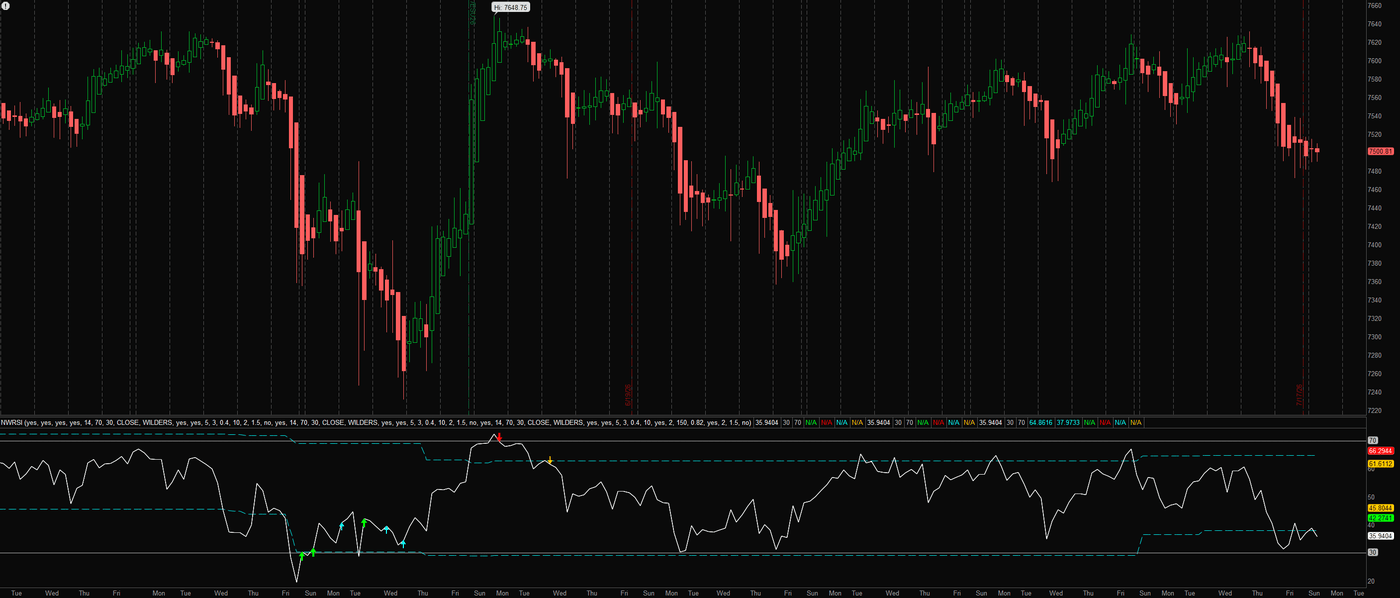
What it measures and how
One RSI, questioned properly. Redirect separates a reclaim of an RSI rail from the next question: does a later pullback hold above the reference low, or does a bounce stay below the reference high? Different arrow colors keep the initial move and its follow-up distinct.
Get started
- Download the thinkScript. In thinkorswim desktop, open Charts → Studies → Edit Studies → Create, replace the template with the complete file, name the study, then apply it.
- Read the lower-pane status label to identify the active rails. Fixed rails are the starting configuration; useAdaptiveRails switches the signal rails to levels calculated from RSI's recent range.
- Watch the green and red base arrows first. Then look for cyan or orange follow-up arrows within the entry waiting window.
- Compare the RSI pattern with price structure. If you enable requireRangeConfirm, fixed and adaptive rail crosses must occur within the selected confirmation window.
How to read it
The initial questionGreen marks an oversold-rail reclaim; red marks a move back below the overbought rail. With requireRangeConfirm off, signalMode selects a simple cross or the strict-plus-momentum mode. With confirmation on, matching fixed and adaptive rail crosses within confirmWithinBars determine the base signal, bypassing signalMode and its momentum tests.
The follow-upCyan marks a qualifying RSI rebound above the reference low from before a base buy signal. Orange marks a qualifying downturn below the reference high from before a base sell signal. The script supports fast rebound or pivot-based follow-up logic.
Rails that adaptThe cyan dashed rails divide RSI's recent high-to-low range. They describe where momentum sits within that range; they are not statistical percentile estimates or a forecast of the next turn.
Know the limits
Signals use the active bar's RSI and can change before that bar finishes. This script does not include a completed-bar confirmation gate.
A base signal can produce more than one qualifying follow-up during its waiting window. A follow-up arrow does not establish that a price reversal will succeed.
Adaptive rails move as RSI's observed range changes. Compare settings on the same symbol and timeframe before interpreting differences.
Open source, no email wall. Read the code, test it on your own chart, and keep it. Explore all 20 free tools.
Keep the tool.
Add a second read.
Redirect separates an initial RSI move from a later pullback or bounce. Keep that focused view.
The paid MIZAN engine runs on TradingView. It adds the market read, the score and explained blocked setups for the candidates it detects. Reversal setups that pass get entry, stop and target references.
MIZAN is a separate engine, not a bundle of these free tools. Compare its read with your own method.
See passed setups, blocked setups and losses →
7-day trial starts at checkout · From $79.99/month afterward · Cancel through Whop · Manual access within six hours after checkout and receipt of your correct TradingView username