Closing Argument
AsksDid fear just spike past normal?
Flags unusually large price stretches above recent lows or below recent highs.
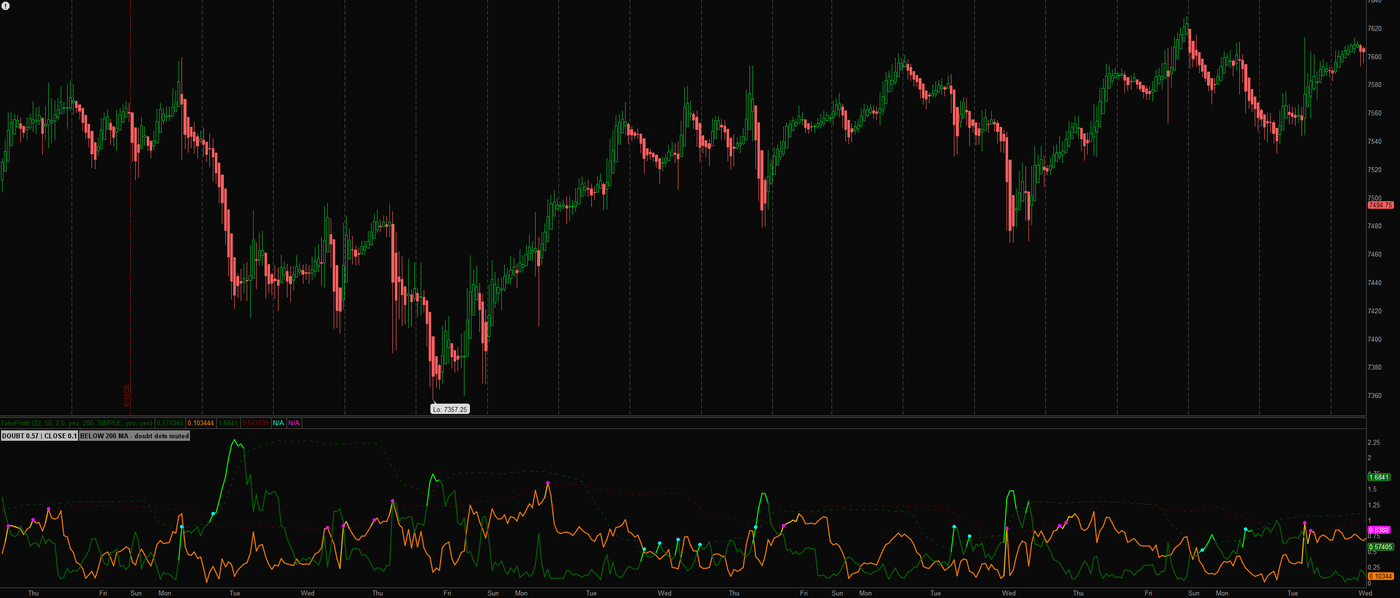
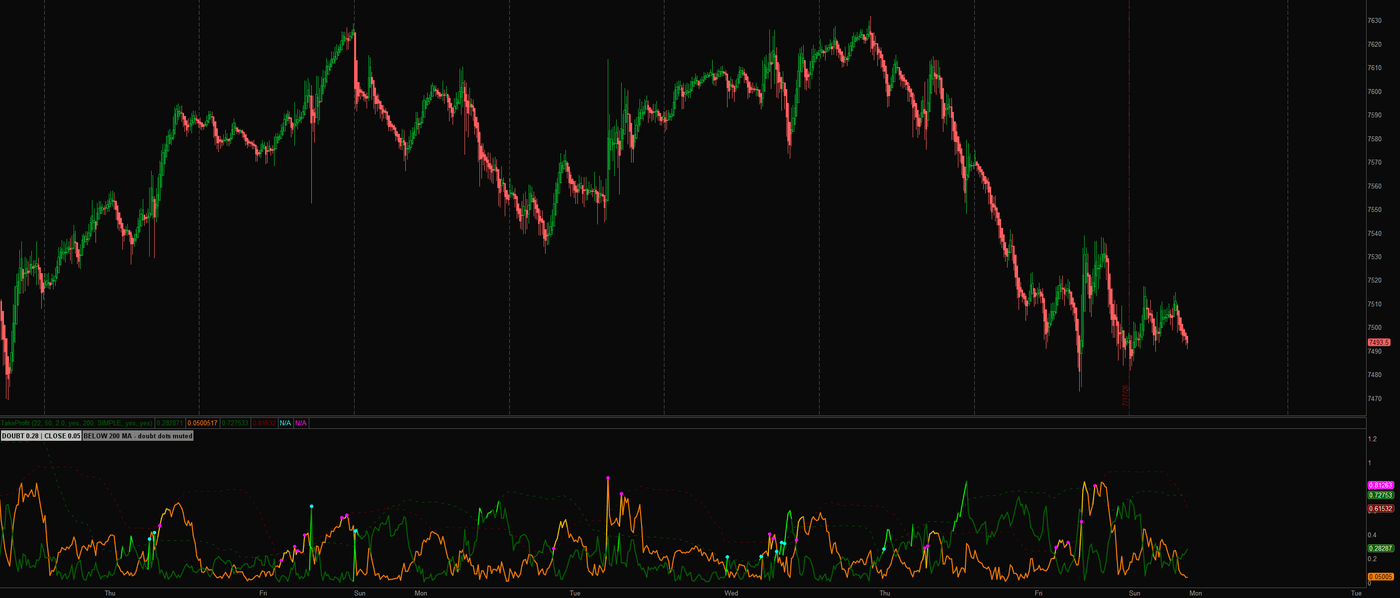
What it measures and how
When price stretches, Closing Argument puts two sides of the move on the record. DOUBT measures the drop from a recent closing high; CLOSE measures the rise from a recent closing low. Each gauge has its own moving statistical band so you can distinguish an ordinary fluctuation from an unusually large excursion in the selected history.
Get started
- Download the thinkScript and paste the complete file into a new study through Charts → Studies → Edit Studies → Create in thinkorswim desktop.
- Read the green DOUBT gauge and orange CLOSE gauge against their own dashed bands in the lower pane.
- Check the status label before interpreting a missing DOUBT dot. The trend filter can suppress that dot when price is below the selected moving average.
- Compare the start of a spike, its continuation, and its return inside the band with the surrounding price action.
How to read it
Two directions of stretchDOUBT uses the current low's percentage distance below the recent highest close. CLOSE uses the current high's percentage distance above the recent lowest close. Fear and euphoria are the tool's shorthand for these price-based measures.
The band is the referenceEach threshold combines that gauge's moving average with a multiple of its standard deviation. A bright gauge means it is above its threshold; a cyan or magenta dot marks a qualifying transition into that state.
What the trend filter changesThe filter affects the onset dot and onset alert for DOUBT. It does not remove the DOUBT line or suppress the CLOSE gauge. The label explains when DOUBT dots are muted.
Know the limits
These are price-derived gauges, not observed investor sentiment, options-implied volatility, or the actual VIX.
A spike identifies an unusual stretch within the chosen history. It does not establish that a top or bottom has formed.
The gauges, thresholds, and current-bar dots can change while the bar is forming.
Open source, no email wall. Read the code, test it on your own chart, and keep it. Explore all 20 free tools.
Keep the tool.
Add a second read.
Closing Argument flags unusually large price stretches. Keep that focused view.
The paid MIZAN engine runs on TradingView. It adds the market read, the score and explained blocked setups for the candidates it detects. Reversal setups that pass get entry, stop and target references.
MIZAN is a separate engine, not a bundle of these free tools. Compare its read with your own method.
See passed setups, blocked setups and losses →
7-day trial starts at checkout · From $79.99/month afterward · Cancel through Whop · Manual access within six hours after checkout and receipt of your correct TradingView username