Live pressure beside price
The arrow shows the estimated pressure side and whether it is building, holding or fading. The forming candle can change before it closes.
MIZAN Flow Basic
See when estimated buying or selling pressure builds, fades or shifts. Start with one familiar chart and compare the pressure with how price responds.
Freeon TradingView
Works on TradingView Basic or higher. Add it directly to a chart with one available indicator slot.
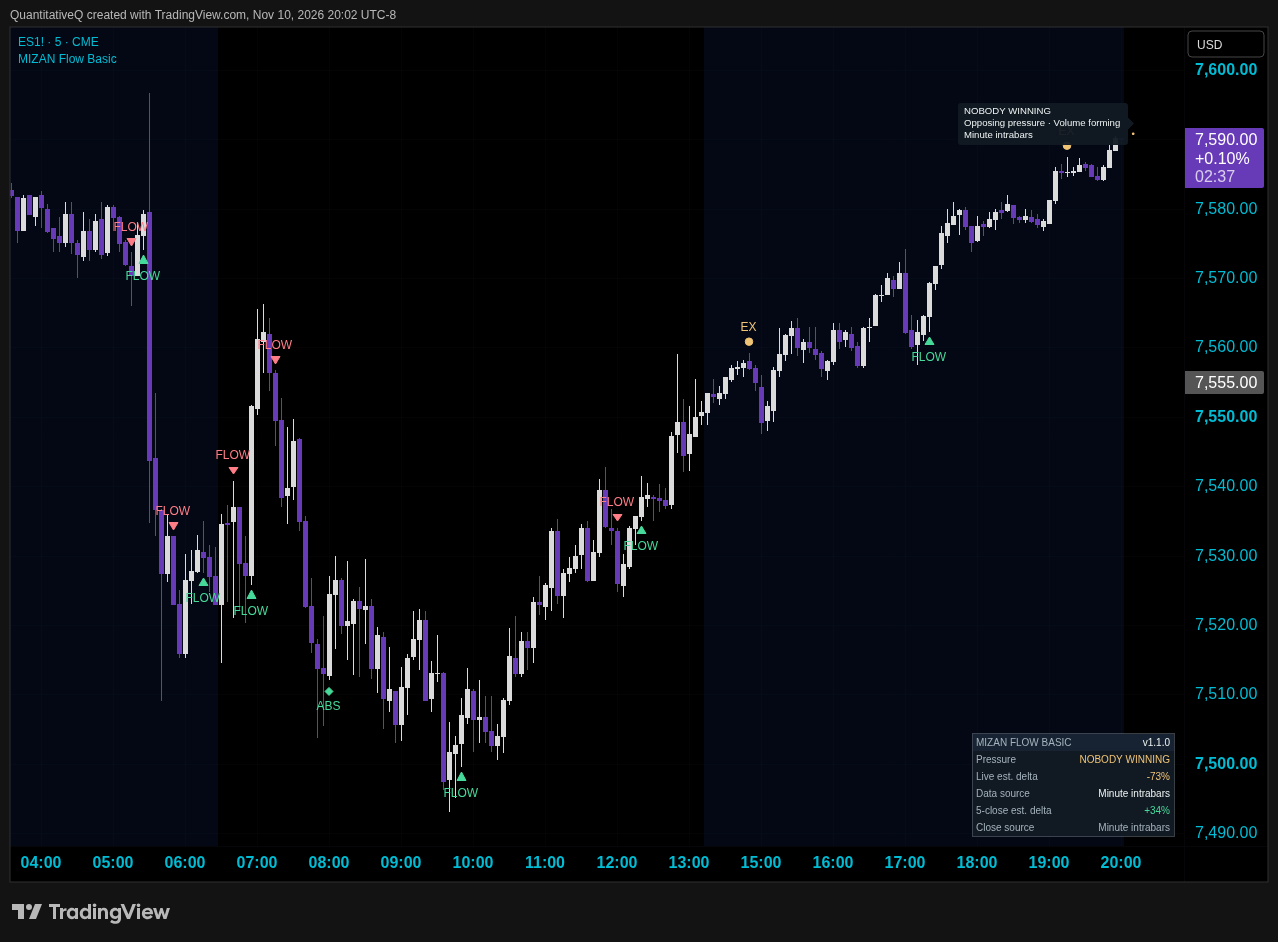
The arrow shows the estimated pressure side and whether it is building, holding or fading. The forming candle can change before it closes.
The dashboard shows the current estimated delta, its data source and the five most recent comparable closed candles.
Optional marks flag confirmed pressure shifts and possible exhaustion. An absorption mark requires minute intrabars and later price confirmation.
See how estimated pressure changes during a futures session and compare it with the candle response.
Compare opening pressure with price on a stock such as AMZN or an ETF such as SPY.
See the pressure reading alongside the developing candle and five comparable closes. The same source and candle checks apply to the selected crypto feed.
Use a symbol and feed that supplies volume or tick volume. Tick volume counts price updates, so interpret it as feed activity.
Trading a cash index? Many index charts have no volume. A related future or ETF measures activity in that instrument. Check the symbol and feed you intend to use. See TradingView’s volume availability notes.
Open MIZAN Flow Basic on TradingView and select Use on chart. Sign in to your TradingView account if prompted.
Start with standard 1 to 5 minute candles. Flow Basic supports 1 to 60 minute candles with usable chart volume.
TradingView Basic allows two indicators per chart. Flow Basic uses one slot.
Flow Basic estimates pressure from price and volume. On 1 minute it uses chart candles. On 2 to 60 minute charts it uses 1 minute intrabars when coverage is sufficient. The dashboard labels a candle estimate when it uses the chart candle instead.
Exchange data availability and delays depend on your feed. TradingView Basic does not include technical indicator alerts. Check TradingView plan limits.
Flow Basic estimates pressure from candles. MIZAN Flow reads TradingView’s native footprint data for price-level pressure, retained imbalance zones and session value.
Flow Pro has a 7-day trial, then costs $9.99/month. The script requires TradingView Premium or Ultimate. Price-level features need usable footprint rows.